1.1 Sampling
Respondents who had lived at least half their lifetime in Washington State were solicited for completing the questionnaire via a convenience sample. The majority of the questionnaires were distributed at institutions of higher education. A total of 318 questionnaires were collected, however only, 229 questionnaires were analyzed. A minimal amount of demographic information was collected from the respondents in order to assure anonymity and keep the questionnaire brief. A balanced regional representation was prioritized over age and gender categories. Eastern and Western are defined according to the Cascade Range of mountains due to its importance as a geographic divide in the state. Table A shows how many respondents hailed from (according to the respondent) the eastern and western regions. Of the 229 respondents, 125 were females and 104 were males. The average age of the respondents is 26.
Table A: Geographic region of respondents
| Region | Respondent |
| Eastern WA | 128 |
| Western WA | 101 |
| total | 229 |
1.2 Questionnaire
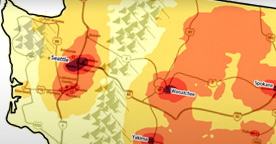
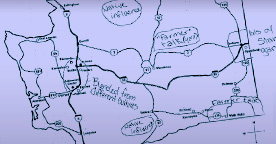
This questionnaire draws on methodology from Preston and Howe (1987) and Preston (1999). It instructs respondents to draw on a map of WA state: “draw a line around places where you think people’s English sounds different. Next, write down what you’d call that way of talking, if you can think if a label for it.” The map used for the study is intentionally simplified in order to allow for general comments/patterns to emerge. Although the Cascade mountain range is present on the maps you see on the results page, they weren’t indicated on the maps that the respondents used (as shown below). (See Lameli, Purschke & Kehrein (2008) for a discussion of map stimuli)
1.3 Analysis of questionnaire
Respondents’ hand-drawn maps were analyzed and compared using ArcGIS 10.0 Geographic Information System software. This software allowed the areas identified on respondent maps to be quantitatively aggregated and queried, permitting detailed analysis of the spatial information captured by the hand-drawn map data.
1.3.1 Analysis Procedure
Each map was scanned and saved as a digital image file so that it could be read by ArcGIS. One-by-one, the hand-drawn shapes on each map were ‘traced’ using a procedure known as ‘heads-up’ or ‘on-screen’ digitizing, resulting in a single GIS polygon ‘feature’ for each shape that a respondent drew on their map. Demographic information about the respondent and the labels they provided for each shape were attributed to each polygon. All of these polygon ‘features’ were combined into a single spatial dataset, which was then used to generate composite maps consisting of features from all the respondents’ and from respondents by region (eastern or western WA). The final composite maps were smoothed for display purposes using a resampling technique known as ‘bilinear interpolation’. 178 of the 229 total maps were analyzed in this way because 51 maps had no shapes identified on them. Of those 51 maps without shapes, 27 maps did have labels (e.g. “hear no difference”). Of those 178 maps with shapes, a total of 463 shapes or GIS polygon ‘features’ were recorded.
1.3.2 Qualitative analysis of labels
A content analysis was performed on the labels given on the maps. The majority of the labels (N=336) were associated with a ‘circle’ or polygon drawn on the map. There were also labels that were made on the questionnaire without any other marking on the map (e.g. “all the same”) or weren’t clearly associated with any one polygon (N=27). Those labels are not included in the count in the table of categories of labels here.
Table: Most numerous categories of labels associated with areas marked on maps
| Category | Number of comments n=336 | examples |
| Country | 86 (26%) | “rednecks”, “farmers” “hick” |
| Spanish | 40 (12%) | “Spanglish”, “Spanish influence”, “Mexenglish” |
| Slang | 25 (7%) | “a lot of slang”, “more slang”, “hella slang” |
| Pronunciation | 24 (7%) | “warshington”, “word pronunciation”, “Different pronunciation slight accent” |
| Canadian | 19 (6%) | “Canadian”, “Canadian influence”, “Lil’ Canada” |
| Gangster | 18 (5%) | “Ghetto”, “gangster”, “lots of ‘ghetto’ slang + gang talk” |