Originally posted on December 10, 2018 at https://fanfictiondatascience.tumblr.com/post/181003693665/exploration-of-fan-fiction-community.
Introduction
At the University of Washington, I am working in a research group that uses data science techniques to explore informal learning in the fan fiction community. To conduct my analysis, I used data collected by past participants in this research group. Specifically, I explored the Doctor Who fan fiction, as it is an accurate sample and is relatively easy to manage.
Method
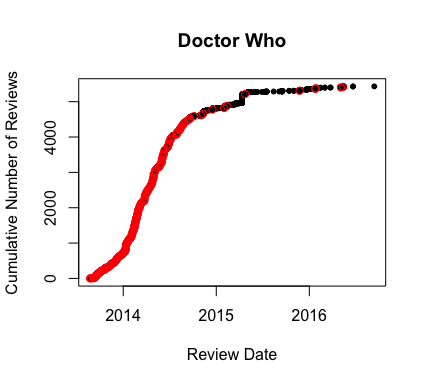
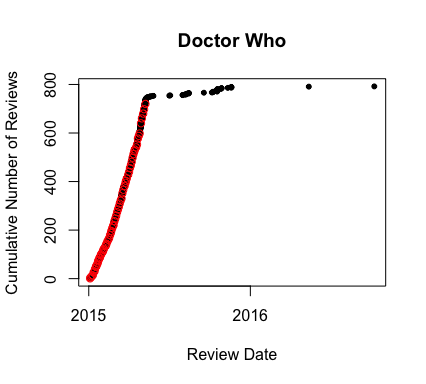
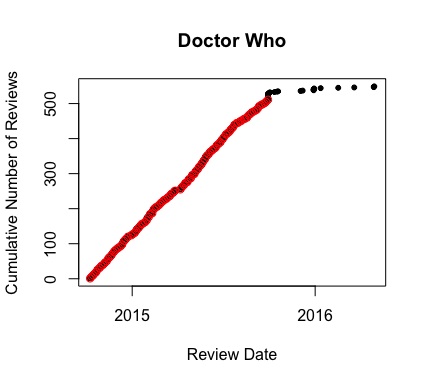
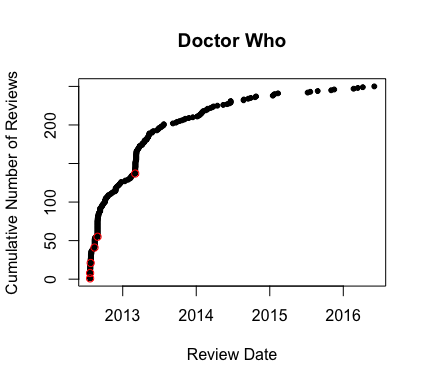
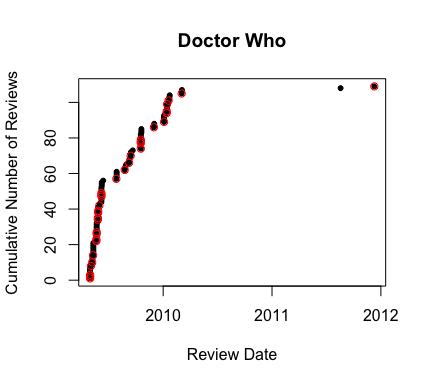
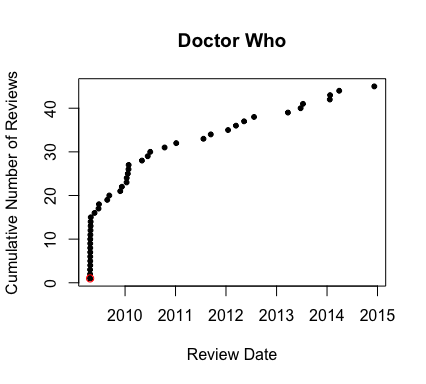
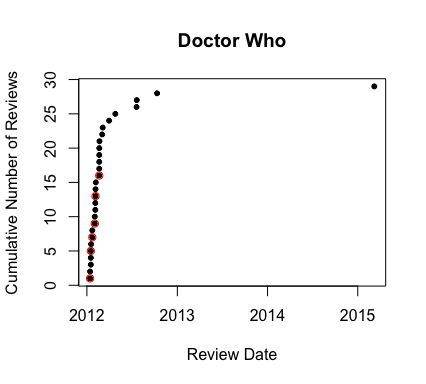
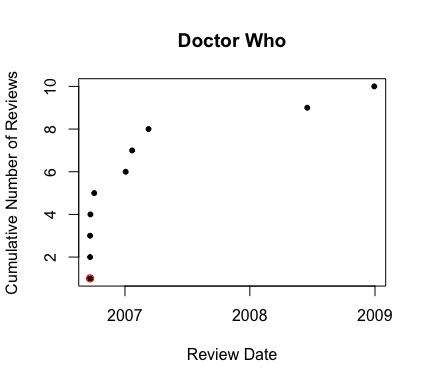
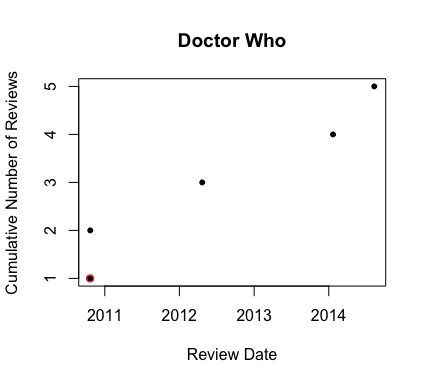
In this blog, I explore how do the popularity of a story and the timing of new chapters affect the running total of reviews received. The x-axis represents the review date while the y-axis depicts the cumulative sum of reviews. Every point on the plot is a review received. The red circles indicate the release of a new chapter.
The Doctor Who dataset I explored contains 53,621 stories. I created three categories to distinguish the popularity of a story — top 5 percentile, following 20 percentile, and bottom 75 percentile due to the long tail. In the top 5 percentile, I sampled the following three stories: Dear Whovian Authors (5,432 reviews), Weathering the Storm (792 reviews), and The Time That We Love Best (549 reviews).
In the next 20 percentile, I sampled the following three stories: Archetype (250 reviews), Misadventures with the Doctor (109 reviews), and Five Times the Sonic Screwdriver was Useless (45 reviews).
In the bottom 75 percentile, I sampled the following three stories: Being Human (29 reviews), Centenary (10 reviews), and Make The Day Go Faster, Please? (5 reviews).
Findings
• The number of reviews increases when a chapter releases, as the new content attracts readers.
• The number of reviews stabilizes after one year from publishing the story.
• Popular stories entice readers soon after the story is published. This may be due to 1) author alerts or story alerts, 2) authors provided a prevue to excite readers, or 3) the story is easily accessible.
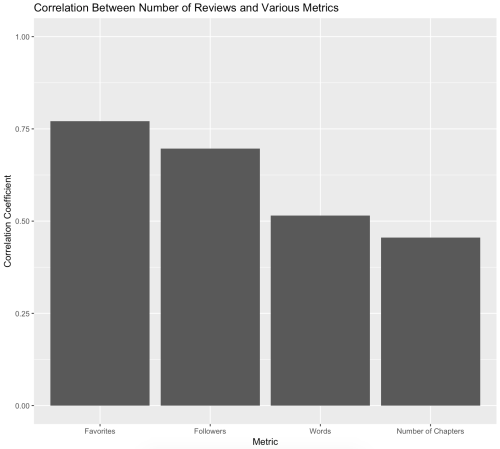
Furthermore, I sought to determine the relationship between the number of reviews and various metrics in the dataset by computing the correlation coefficients. A correlation coefficient is a statistical measure that calculates the strength of a relationship. A correlation of 0.0 shows zero or no relationship between the variables while 1.0 shows a perfect positive correlation. As depicted in the figure below, favorites have the highest correlation with the number of reviews. This is because readers closely track updates, which leads to increased reviews. The number of chapters, however, does not guarantee higher reviews. For example, Archetype has 250 reviews but only 6 chapters.
Limitations and Future Work
For this analysis, I used the first review of the new chapter as the chapter’s published date. In the future, I want to investigate how does the structure of subcommunities affect reviewing in a fanfiction network. Additionally, I want to provide authors a guideline to increase followers and favorites and, consequently, increase the number of reviews.
