|
Mapping Race in Seattle/King County 1920-2010
1920Segregation began with Asian Americans, who have outnumbered African Americans through most of Seattle's history. Chinese people were tightly confined in Chinatown before that community was destroyed and its residents forced to flee in 1886. Japanese immigrants built Nihommache (Japan town) next to the rebuilt Chinatown in the early 1900s and soon became the largest nonwhite group in Seattle. African Americans filtered slowly into the area and initially residential restrictions were loose and informal. By 1920, as can be seen on these maps, Black families were more dispersed than Asians, but were mostly living in the Central Area near Japanese and Chinese residents. In the following decades, new tools of segregation would be used to make the boundaries firmer. Racial restrictive covenants (see database and article) and other deed provisions would make it illegal for property to be sold or rented by Blacks, Asians, and often Jews in most parts of the city and surrounding county.
1940
1950King County population had increased 45% in the decade since 1940 thanks to the World War II influx of defense workers and military personnel. The county claimed 732,992 residents in 1950. Despite significant increases in the number of African Americans who had come to help the war effort, the population remained 96% white. Blacks numbered 16,453 and the combined Asian origin population was 12,790. Rules of segregation limited where Blacks, Asians, and Jews might live, enforced by deed restrictions, racial restrictive covenants, and by compounding systems of discrimination organized by the real estate industry and white neighborhoods. Still, Seattle and the county had not reached the level of segregation that would be in place by 1960. (click maps for more detail).
1960King County population had increased 38% in the previous decade, reaching 935,014 by the time of the April Census. Whites accounted for 94% of county residents joined by 27,805 African Americans, 10,789 Japanese American, 4,434 Filipinos, 4,321 Chinese Americans, and severla hundred other Asian Americans. The population of Native Americans was also growing, reaching 2,929 and there was a small but uncounted number of Latinos. Tight segregation remained the rule. Discrimination on the basis of race remained fully legal and widely practiced by real estate agents, landlords, white property owners and neighborhood associations. Nearly Black, Asian, and Native American families were locked in a triangle of census tracts in the Central District and Chinatown. Small pockets of Black residents remained in the High Point housing project, but the number living in Sodo and Georgetown area had declined as did the total population of these areas as freeways, warehouses and industrial sites moved in. (click maps for more detail).
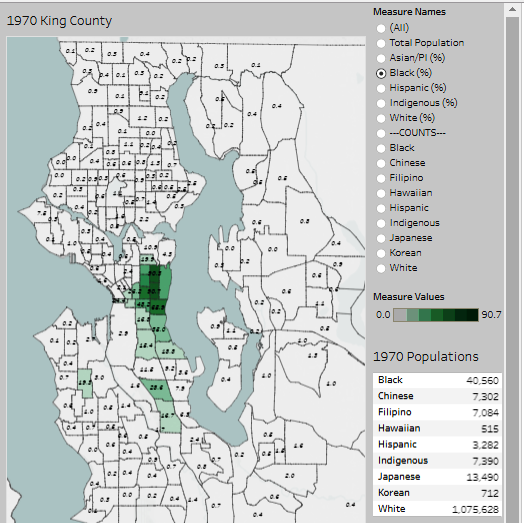
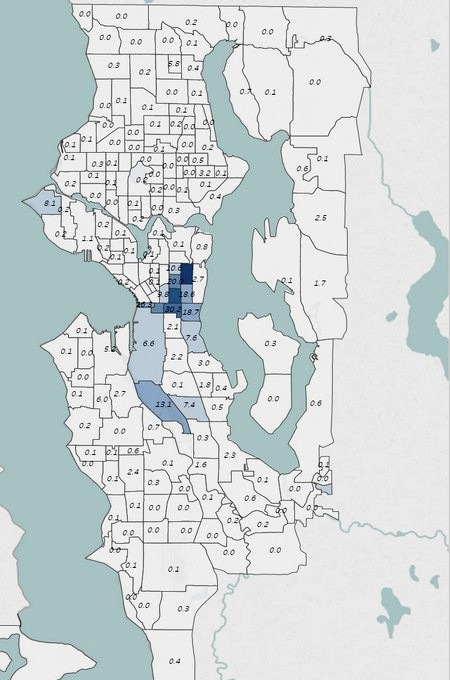
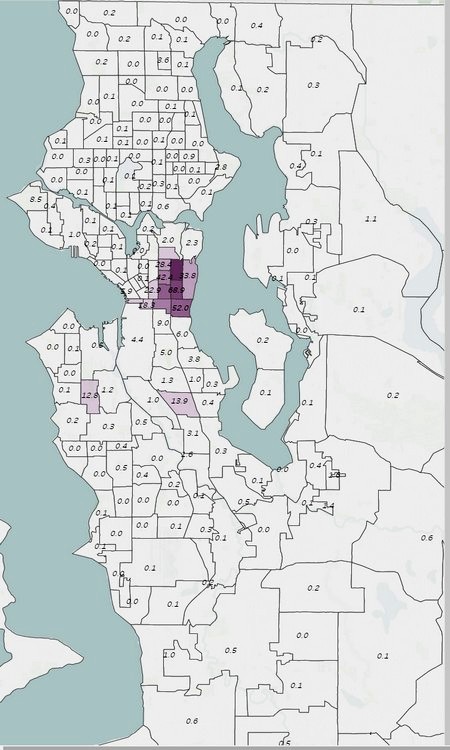
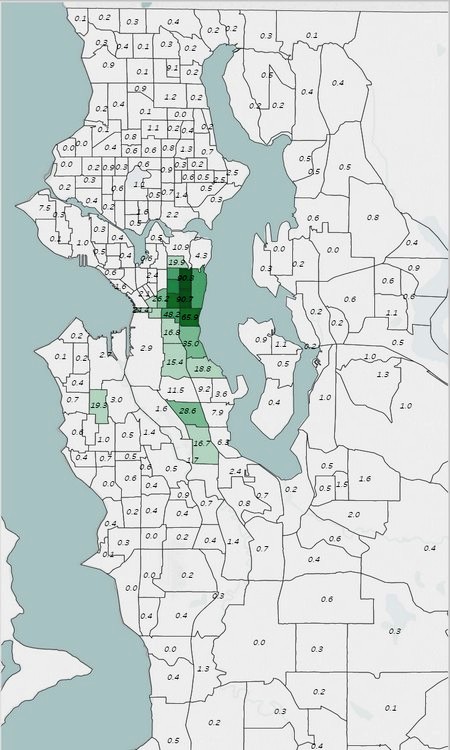
1970King County population had increased 26% in the previous decade, reaching 1,182,311 by the time of the April Census. Whites still accounted for 93% of county residents joined by 40,597 African Americans, 29,141 Asian Americans, 7,391 Native Americans. The Census Bureau was for the first time trying to systematically count people of Hispanic heritage, identifying 3,283. In 1968, Congress had passed a law banning racial discrimination in housing and Seattle's City Council enacted a similar ordinance. By 1970, there was little evidence that King County housing markets had responded. Both African Americans and Asian Americans (especially Japanese and Chinese) were spreading south from the CD into the contiguous neihborhoods of Beacon Hill and Black families had broken the barriers that previous had kept them out of the Madrona District. But North Seattle and the rest of King County remained as racially restricted as ever. (click maps for more detail).
1980King County population had reaching a population of 1, 266,241 by 1980, still 88% white. Arican Americans now numbered 55,950 and had recently been surpassed by the combined number of Asian Americans and Pacific Islanders at 58,712. There was new diversity in that population as immigrants from Korea, Vietnam, and other Asian nations joined the older populations of Japanese, Chinese, and Filipinos. The southern spread that had begun in the late 1960s continued for both African Americans and Asian Americans and the first glimers of Central District gentrification appeared as the number of whites increased in that area for the first time since World War II. But for most of Seattle and the rest of the county little had changed. North of the ship canal remained virtually all White, as did West Seattle, the East Side, and South King County. (click maps for more detail).
1990King County population had increased 19% in the previous decade to a total of 1,506,373, whites accounting for 84%, a slowly declining ration. The population growth among peoples of Asian and Pacific Island ancestries had grown fastest and now at 118,753 significantly outnumbered the county's 76,212. The Hispanic/Latino population was also surging. Only 3,282 in 1970, they numbered 44,286 in 1990. Urban Indians had also been moving to Seattle, more than doubling their population to 17,286 from 1970. The southern diaspora from Central Seattle continued for all of the populations of color. Now all of southeast Seattle from the Beacon Hill through the Rainier Valley as becoming a multiracial zone where Asians of many nationalities, Blacks, Whites, Native Americans, and Latinos shared census tracts, if not every school and neighborhood. Some Asian Americans were breaking barriers in other neighborhoods. In parts of Bellevue, Kent, and far north Seattle, census tracts the percentage of Asian American residents moved gently past 10%. That was not the case for African American families. In North Seattle, West Seattle, and the East Side, the segregation needle had barely budged. Most of these census tracts claimed 1-2% Black residents, if that. (click maps for more detail).
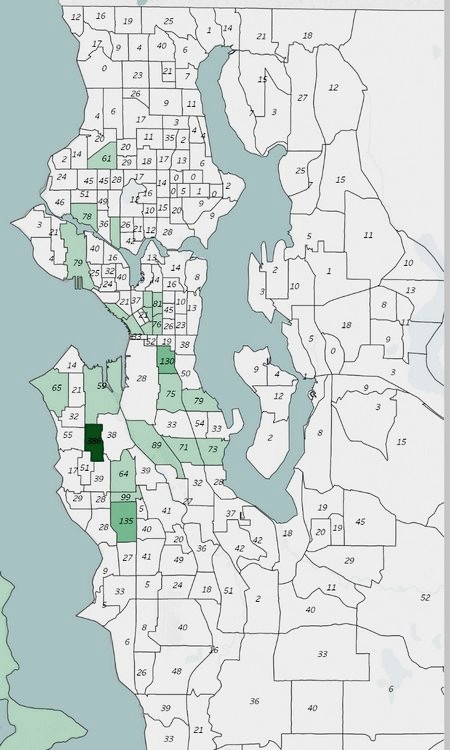
2010Jumping ahead 20 years, the county had maintained its impressive growth rates, 28% over the two decades. In 2010, the population reached 1,931,249. These decades had registered significant changes in racial distributions. Whites now comprised 69% of the population and immigration had greatly increased both Asian ancestered and Hispanic populations. The King County population had increased 14% in the previous decade, reaching 935,014 by the time of the April Census. Whites accounted for 94% of county residents joined by 27,758 African Americans, 23,360 Asian Americans, xxxx Native Americans, and a small but uncounted number of Latinos. In 1968, Congress had passed a law banning racial discrimination in housing and Seattle's City Council enacted a similar ordinance. By 1970, there was little evidence that King County housing markets had responded. Both African Americans and Asian Americans (especially Japanese and Chinese) were spreading south from the CD into the contiguous neihborhoods of Beacon Hill and Black families had broken the barriers that previous had kept them out of the Madrona District. But North Seattle and the rest of King County remained as racially restricted as ever. (click maps for more detail).
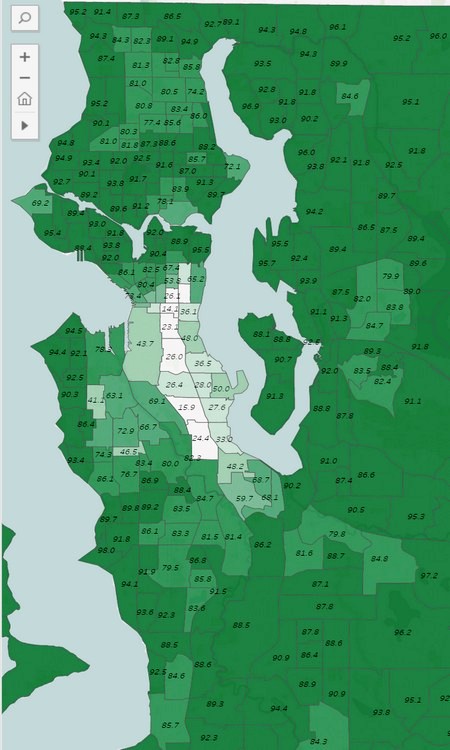
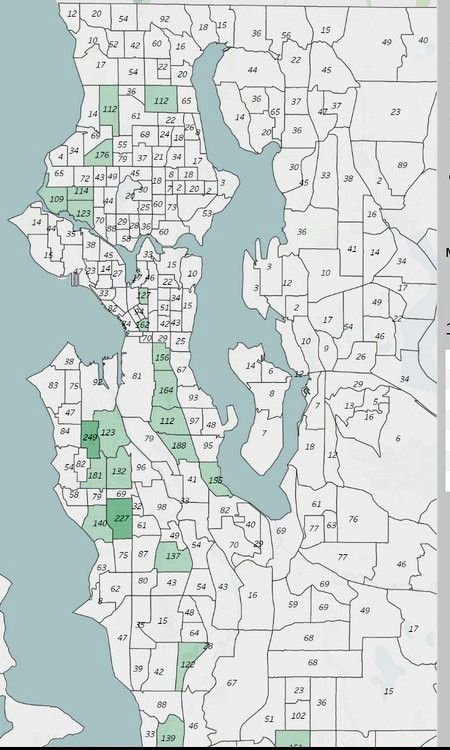
White population distributionsNote the uneven patterns of desegregation on this sequence of maps. Southeast Seattle and southern King County became the principal areas of desegregation after laws changed in the late 1960s. The percentage of Whites living in these census tracts dropped steadily while Blacks, Asians, Latinos, and Natives moved in. After 1990, some areas on the east side also become more mixed with White percentages dropping below 70%, with the addition of Asian American families. But much of North Seattle remained in 2010 almost as exclusively White as it had been fifty years earlier. The was equally true in Magnolia, Queen Anne, West Seattle, Madison Park, and wealthy, waterfront neighborhoods east of Lake Washington.
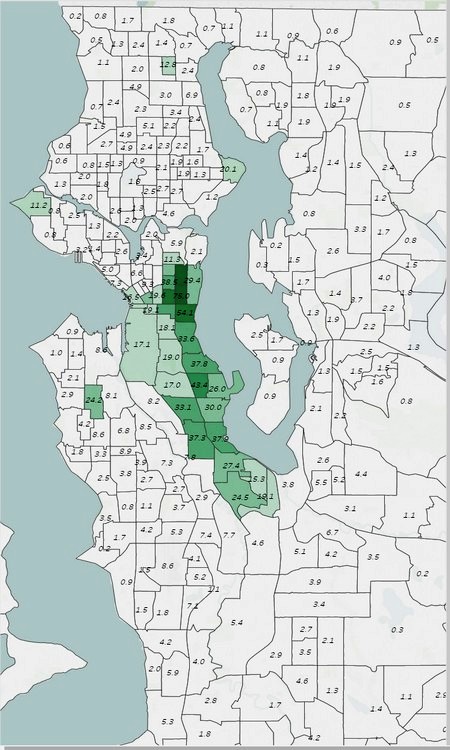
Native American population distributionsBefore 1970, the Census Bureau did not specify the number of American Indians and Alaskan Natives in census tract calculations. They appeared as part of the "Other race" category in earlier censuses. Native populations had declined precipitously in the 19th century and none of the local tribes had been allowed federal recognition or reservations in King County.
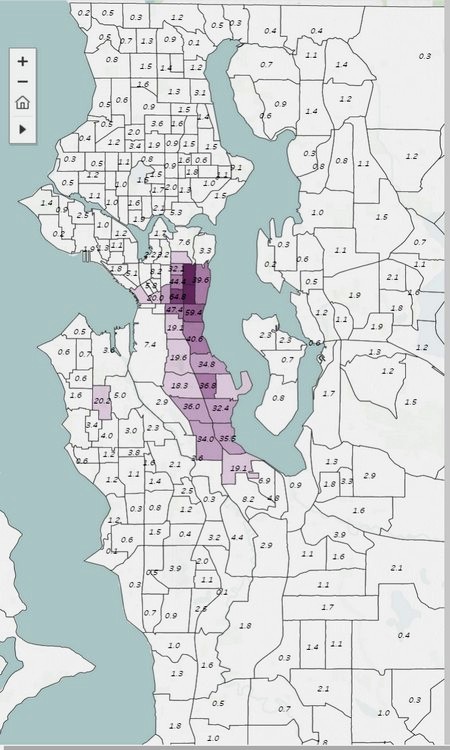
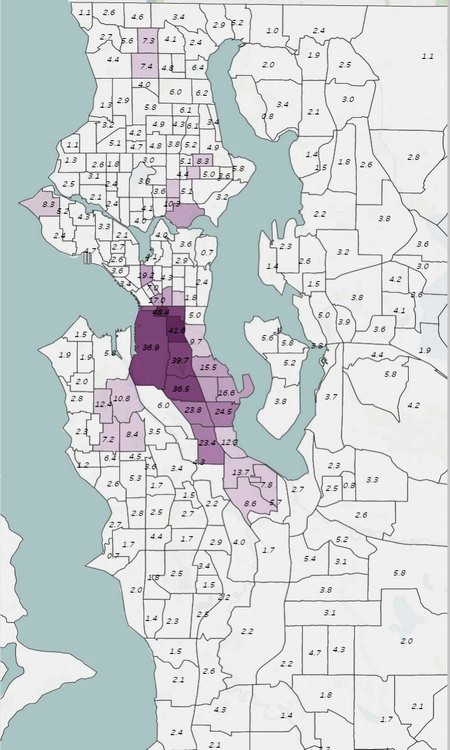
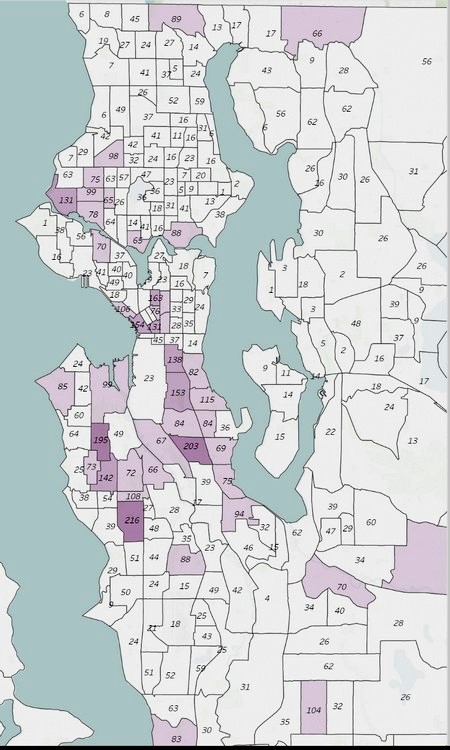
Hispanic/Latino population distributionsIt was not until 1970 that the Census Bureau introduced a reliable set of questions to cuunt people of Latin American heritage. That year 3,282 people identified as Hispanic in King County and the population was beginning to grow, numbering 44,286 twenty years later in 1990. These maps show Latinos dispursing widely, living in mixed census tracts where they rarely exceed 30% of the population. Southwest Seattle and Renton have developed as areas of some concentration in the last 20 years.
Credits
| |||
[an error occurred while processing this directive]