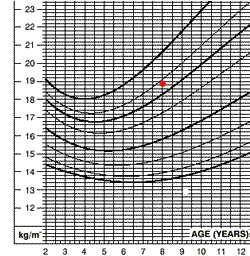
Scenario 2 - continued

Mary's BMI is between the
85th and 95th percentiles for age. According to the CDC guidelines, you
assess Mary to be:

 |
||
|
|
Scenario 2 - continued
Mary's BMI is between the
85th and 95th percentiles for age. According to the CDC guidelines, you
assess Mary to be:
|
|
| Glossary | Module Index | Home | ||