|
Section 2: Assessment Guidelines
Once accurate measurements are made, the data are compared to growth
charts that are based on the growth patterns of thousands of children
in the United States (CDC Growth Charts) or charts based on thousands of measurements (WHO Growth Standards). This section reviews the development and use of
these growth charts. These charts
are a compilation of data-measurements of children who participated in
the National
Health and Nutrition Examination Surveys (NHANES): NHANES (1971-74),
NHANES II (1976-80), and NHANES III (1988-94).
Information about
the growth charts and downloadable versions of the charts can
be found on the CDC website: http://www.cdc.gov/growthcharts.
 |
|
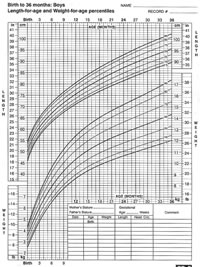
WHO growth charts are available for children 0-24 months (weight-for-age, length-for-age, head circumference-for-age,
weight-for-length)
- These charts were based on data from the WHO Multicentre Growth Reference Study (MGRS) – 18,973 observations for 882 children
- Children in the MGRS lived in environments believed to support what WHO researchers view as optimal growth of children
- Some of the inclusion criteria: predominantly breastfeeding at 4 months, breastfeeding at 12 months, complementary food introduced at mean age 5.4 months
- Some of the exclusion criteria: low socioeconomic status, birth at <37 weeks or >42 weeks, multiple birth, perinatal morbidities, child health conditions known to affect growth, weight-for-length >3 SD +/- study mean
|
 |
|
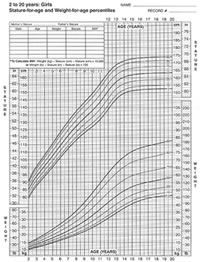
Charts for 2 to 20-year
olds (weight-for-age, stature-for-age, Body
Mass Index [BMI]-for-age, weight-for-stature [for children 77-121
cm only])
- These charts are based on data from the five previous
NHANES surveys
- NHANES III data were not used for the weight-for-age
and BMI-for-age percentiles for children over age 6 years
- Like the charts for younger children, these represent
the racial/ethnic diversity of the US
|
|
