Example Data
Note: Localized cards are blurred to protect the identity of the respondents.
The following data sets asked participants to rank academic subjects they believed should be more prioritized in their local school district.
The data was taken from this study: Hugo, R. (2015). Language Attitudes of Non-Indigenous Individuals Residing Near an Indigenous Community in Washington State. University of Washington Working Papers in Linguistics (UWWPL). Volume 33.
The scale for all of the data is 1-10.
y = the upper bound of the scale (e.g., 1-5 on a Likert scale or 1-10)
n = the number of vertical positions
z = the scale value of x
| (x-1) |
(y-1) (n-1) |
+ 1 = z |
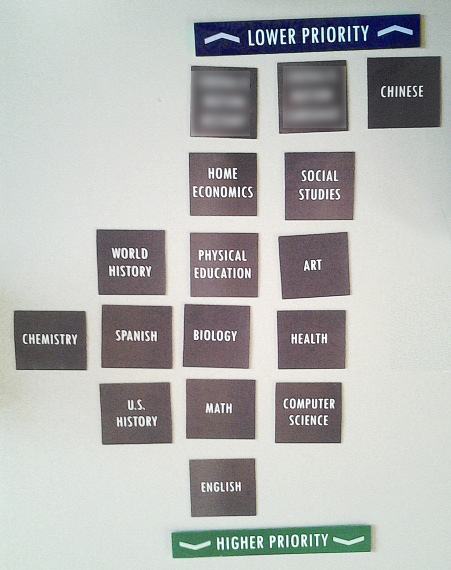
Example Participant data set 1
| Vertical Position | Value | Academic Subjects Represented |
| 1 | 1.0 | Local Indigenous History, Local Indigenous Language, Chinese |
| 2 | 2.8 | Home Economics, Social Studies |
| 3 | 4.6 | World History, Physical Education, Art |
| 4 | 6.4 | Chemistry, Spanish, Biology, Health |
| 5 | 8.2 | U.S. History, Math, Computer Science |
| 6 | 10.0 | English |
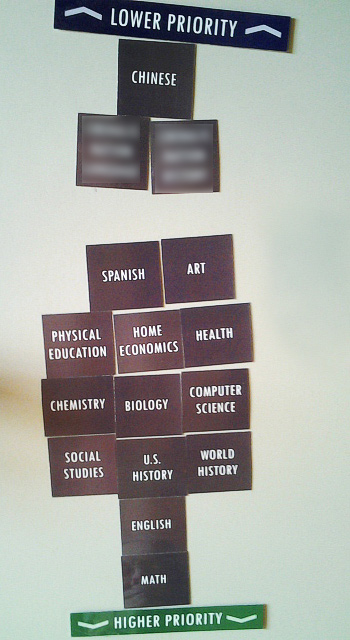
Example Participant data set 2
Note that this participant added an extra blank vertical position between the 2 and 4 vertical positions emphasizing and even lower priority.
| Vertical Position | Value | Academic Subjects Represented |
| 1 | 1.0 | Chinese |
| 2 | 2.125 | Local Indigenous History, Local Indigenous Language |
| 3 | 3.250 | |
| 4 | 4.375 | Spanish, Art |
| 5 | 5.5 | Physical Education, Home Economics, Health |
| 6 | 6.625 | Chemistry, Biology, Computer Science |
| 7 | 7.75 | Social Studies, U.S. History, World History |
| 8 | 8.875 | English |
| 9 | 10.0 | Math |
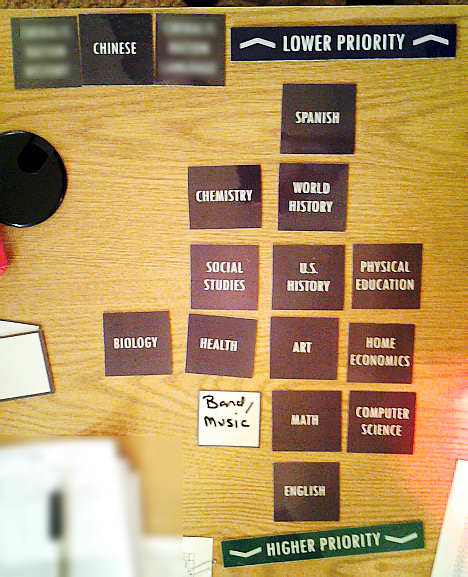
Example Participant data set 3
Note that this participant moved three cards beyond the lower priority card to indicate that they shouldn't be a priority at all.
| Vertical Position | Value | Academic Subjects Represented |
| 0 | 0 | Local Indigenous History, Chinese, Local Indigenous Language |
| 1 | 1.0 | Spanish |
| 2 | 2.8 | Chemistry, World History |
| 3 | 4.6 | Social Studies, U.S. History, Physical Education |
| 4 | 6.4 | Biology, Health, Art, Home Economics |
| 5 | 8.2 | Band/Music, Math, Computer Science |
| 6 | 10.0 | English |