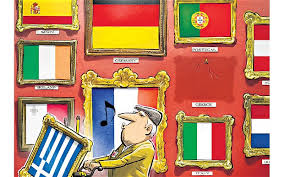
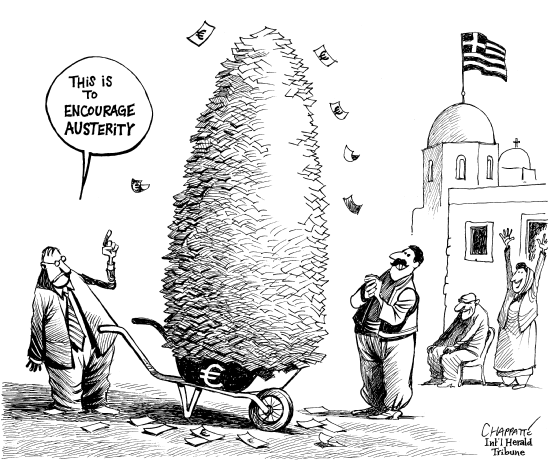
One would think a Euro is a Euro is a Euro. The same piece of paper in Athens is issued and administered in a common fashion across the eurozone. But not so. The Wall Street Journal has a great article summarizing the European system of Central Banks, administering and issuing currency and debt”
How Does the Eurosystem Work?
By Charles Forelle6:17 AM EST JUL 10, 2015
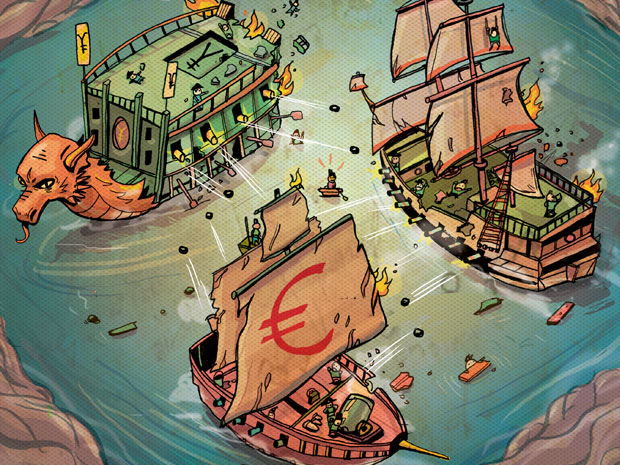
A Greek exit from the eurozone would be a social, political and economic cataclysm. It would also make a mess of the Eurosystem, the carefully constructed central-banking arrangement that underpins the 19-nation currency union. What would happen to it if one country fell out? We’ll step through the implications, including for Target2, the transnational payment system that has caused a huge fuss in Germany.
How are central banks set up in the eurozone?
What we think of as the European Central Bank is really the “Eurosystem”: the 19 central banks of eurozone countries plus the ECB itself. The vast bulk of ECB’s balance sheet—its assets and its liabilities—is held by the national central banks. They function as sort of branches of the broader ECB. This is a consequence of Europe’s imperfect union: All the eurozone countries retain their own central banks and their own banking systems, even though the system’s policies and rules are set centrally.
In normal times, this is a distinction without a difference. But when one country is on the cusp of leaving, it starts to matter.
How do commercial banks operate in the eurozone?
They interact and transact with the central bank of their home country.
Commercial banks have their own deposit accounts with the local central bank. When they need central-bank loans, they turn to the local central bank. That means that, say, Piraeus Bank (a Greek bank) gets funding from the Bank of Greece.
A customer’s deposit in a commercial bank is simply an amount the bank owes the customer. When a customer of Piraeus Bank transfers €1,000 ($1,117) to another Piraeus Bank customer, Piraeus notes in its ledger that it now owes €1,000 less to Customer A and €1,000 more to Customer B.
When the Piraeus customer transfers €1,000 to a customer of Alpha Bank (another Greek bank), the Bank of Greece gets involved.
Just as a customer deposit with Piraeus is an amount Piraeus owes the customer, Piraeus itself has a deposit account with the Bank of Greece that shows how much the Bank of Greece owes it.
In the transfer from a Piraeus customer to an Alpha customer, the Bank of Greece notes in its ledgers that it now owes Piraeus €1,000 less and Alpha €1,000 more. Piraeus notes that it owes its customer €1,000 less and Alpha that it owes its customer €1,000 more.
(This, incidentially, is why electronic transfers within Greece are permitted by the capital controls.)
OK, so what happens if a Piraeus customer transfers €1,000 to, say, an account in Germany with DeuTsche Bank?
Well, the customer can’t anymore because of capital controls, but let’s go back to a time when he or she could.
Piraeus deals with the Bank of Greece and Deutsche Bank with the Bundesbank, Germany’s central bank. That makes the transfer more complicated. The central banks themselves don’t have a “master” central bank with which they both have deposit accounts. Instead, the Eurosystem operates a system called Target2 to handle the payment.
The €1,000 transfer works like this: Piraeus notes that it owes the customer €1,000 less. The Bank of Greece notes that it owes Piraeus €1,000 less. The Bundesbank notes that it owes Deutsche Bank €1,000 more. Deutsche Bank notes that it owes the customer €1,000 more.
In between the Bank of Greece and the Bundesbank sits Target2. The Target2 system notes that the Eurosystem owes the Bank of Greece €1,000 less and the Bundesbank €1,000 more.
Target2 operates every business day; over time these credits and debits add up, and every central bank has either a positive or negative balance toward the Eurosystem.
How big are these balances?
In precrisis times they were pretty small. That’s because banks in the eurozone used to lend money to each other quite readily. If a Piraeus customer transferred €1,000 to a Deutsche Bank customer, that might have been offset by a loan from Deutsche Bank to Piraeus (or another German bank to another Greek bank)—which is money moving the other way. Thus the Target2 flows cancelled each other out.
How about now?
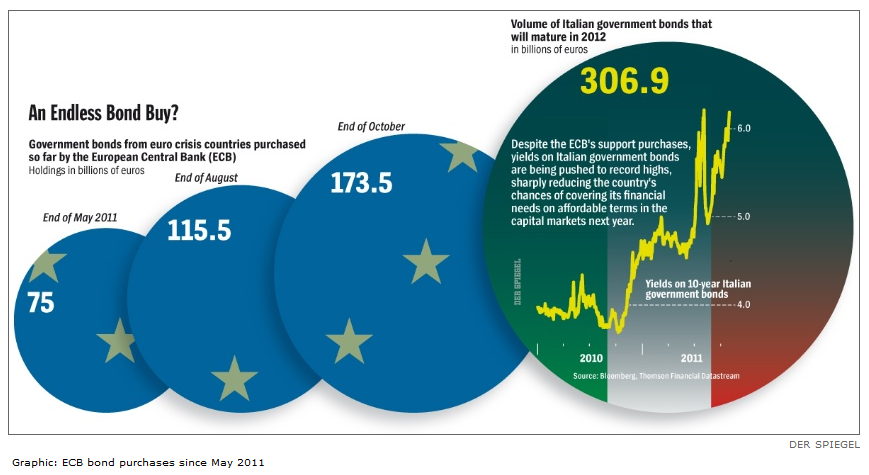
Now, not so much. Greek banks have been cut off from international markets for months; in order to get €1,000 to transfer to a German bank, a Greek bank would’ve had to borrow it from the Bank of Greece. The outgoing flows have not been offset by incoming flows, and so the Bank of Greece’s Target2 balance has ballooned. It was minus €100 billion at the end of May. By contrast, the Bundesbank’s balance was positive €526 billion at the same time.
So Germany is lending money to Greece through the central banks?
Not exactly. Let’s get philosophical. We need to understand the nature of a euro.
Where do euros come from?
Banks make them. Loans create deposits. If the bank lends you €200,000 for a mortgage, it notes in its ledgers that it you owe it €200,000 (that’s an asset to the bank) and credits your deposit account with €200,000 (that’s a liability for the bank). Voila, some new euros are born. You transfer them to the house seller, and off they go into the financial system.
Banks can’t make euros like this infinitely: Regulatory constraints bind how much risk they can take (a loan is risky), and the central bank requires that they hold an amount equal to a certain fraction of their loans as deposits with the central bank.
Since the central bank controls how much of this central-bank money exists for these deposits, the central bank controls the ability of the commercial banks to make loans and create euros.
In effect, there are 19 systems creating euros—”French euros,” “Spanish euros,” “German euros,” “Greek euros” and so on. What makes all of these euros euros is that Target2 works: a euro in one place can be sent, through the central banks, to another place, where it is still a euro.
But don’t the central banks make euros, too?
Yes, and it is this central-bank money that is “moved” between central banks via Target2. Central banks make euros the same way commercial banks do, by making loans. (They also buy bonds, as in quantitative easing.)
The central bank makes a loan to a commercial bank. It records in its ledger a loan to the bank (an asset) and a deposit to the bank’s account (a liability). In normal times, the central bank doesn’t need to do very much of this: banks can get loans from other banks if they need funds. But since the onset of the crisis, the ECB has let banks have as much funding from the central bank as they need, on generous terms, so long as they can put up some assets as collateral to secure the loan.
And in a pinch, the central bank gives emergency funding in this way—as the Bank of Greece has been doing for Greek banks—against less-secure collateral.
So have all the central banks been creating euros like this?
Some much more than others. The Bank of Greece, as of May, has created €116 billion through lending to its banks, both regular and emergency. The Bundesbank has created just €35 billion.
It is this outsized creation of euros that allows the buildup of the Target2 balance: In essence, the Greek central bank has been creating euros that its banks can send elsewhere.
Does the Bank of Greece ‘owe’ this sum to the Eurosystem?
In an accounting sense, yes. It pays interest on its Target2 balance, though it never has to be repaid. (A similar thing happens with banknotes; a central bank that issues excess banknotes pays interest to the Eurosystem. The Bundesbank is a big excess issuer of banknotes.)
So if Greece leaves the euro, does the Eurosystem have a €100 billion loss?
Not necessarily. Let’s look at the Eurosystem’s balance sheet. Its balance sheet is the sum of all the balance sheets of the 19 national central banks and the ECB itself. The Eurosystem’s assets are mostly gold, foreign reserves, loans to eurozone banks and bonds it has bought under various bond-buying programs including quantitative easing.
Its liabilities are mostly banknotes and the deposit accounts maintained by eurozone banks.
Hidden in the Eurosystem’s balance sheet are the amounts that the central banks owe each other; they sum to zero. The Bank of Greece owes €116 billion (€100 billion for Target2, €18 billion for excess banknotes, minus €2 billion for other stuff it is owed). It has a liability of €116 billion.
Because all these claims balance each other out, the rest of the Eurosystem has an asset of €116 billion: a claim on the Bank of Greece. Thus, if the Bank of Greece were simply chopped out of the Eurosystem, the new Eurosystem’s balance sheet would record that claim as an asset.
But surely that asset isn’t worth €116 billion?
Maybe not, but it possibly doesn’t matter. If the post-Grexit Bank of Greece repudiated that claim, the post-Grexit Eurosystem might have to take a writedown and book a loss. A loss would be shared among the central banks and could lead countries to recapitalize the system.
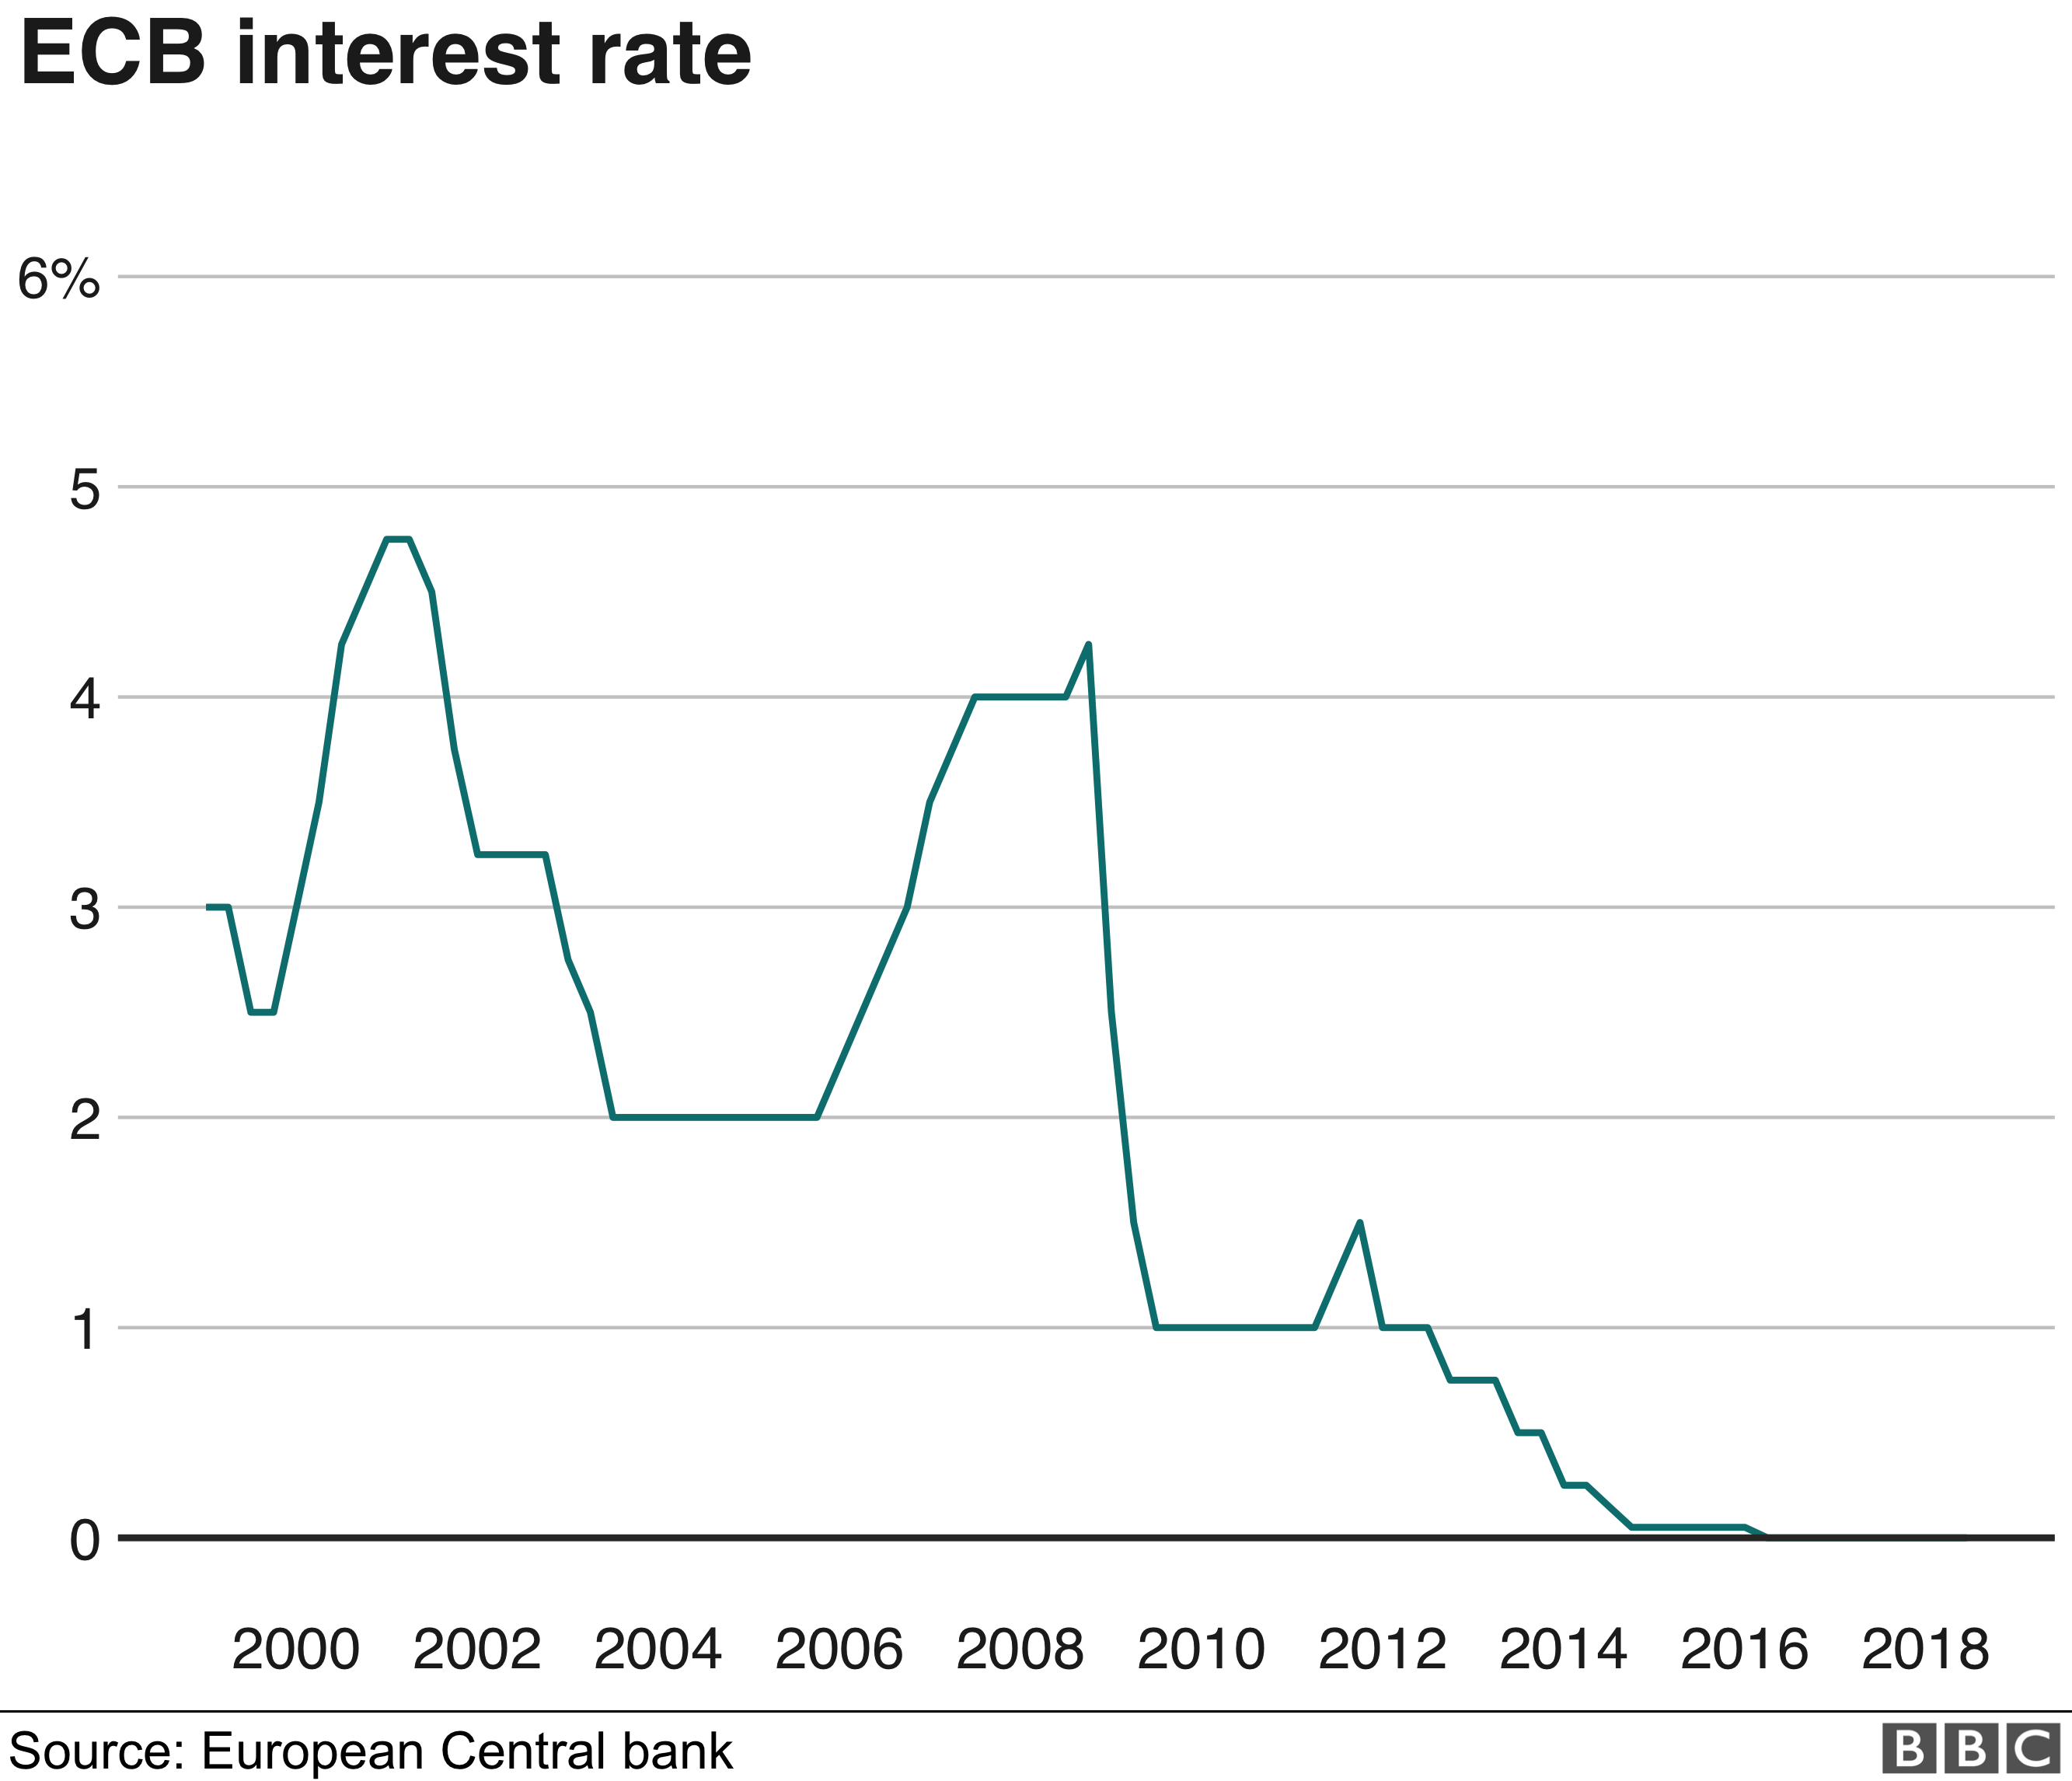
The economist Karl Whelan makes the point, in a comprehensive paper on Target2, that Greece wouldn’t necessarily have to, or want to, repudiate the claim. Being able to transact payments in euros is useful, and Greece could remain part of Target2 even if it exits the eurozone: several noneuro EU countries are part of it. “The claims can be honoured simply by making the necessary interest payments,” Prof. Whelan writes. At the current rate of 0.05%, the annual bill would be around €50 million.
What about the rest of the Eurosystem’s balance sheet?
The imperfect union of Europe actually helps in a divorce: because all the Greek banks transact with the Bank of Greece, the Greek system could be more easily hived off.
One sticky point is banknotes. Greek banks’ electronic deposits with the Bank of Greece could be switched into drachma at the press of a button. But the euro banknotes it has issued to commercial banks can’t be pulled back. The Bank of Greece has issued €45 billion in banknotes—its regular allocation of €27 billion plus an additional €18 billion.
It’s not clear what would happen. One solution is to consider a post-exit Greece’s regular allocation of banknotes to be 0 instead of €27 billion—it’s not in the eurozone, after all.
Then, that €27 billion gets added to Greece’s excess issuance, and becomes part of its liability to the new Eurosystem, taking it from €116 billion to €143 billion.
Will it ever pay that back?
Maybe, eventually. Target2 liabilities and banknote liabilities don’t have to be repaid—they exist in perpetuity, fluctuating over time. But if Greece leaves the eurozone, its Target2 and banknote liabilities won’t soar again, because it can no longer print euro banknotes and it can no longer create euros by lending them to its banks.


/cdn.vox-cdn.com/uploads/chorus_image/image/65359383/wwdc2019DSC_4114.0.jpg) Photo by Nilay Patel / The Verge
Photo by Nilay Patel / The Verge
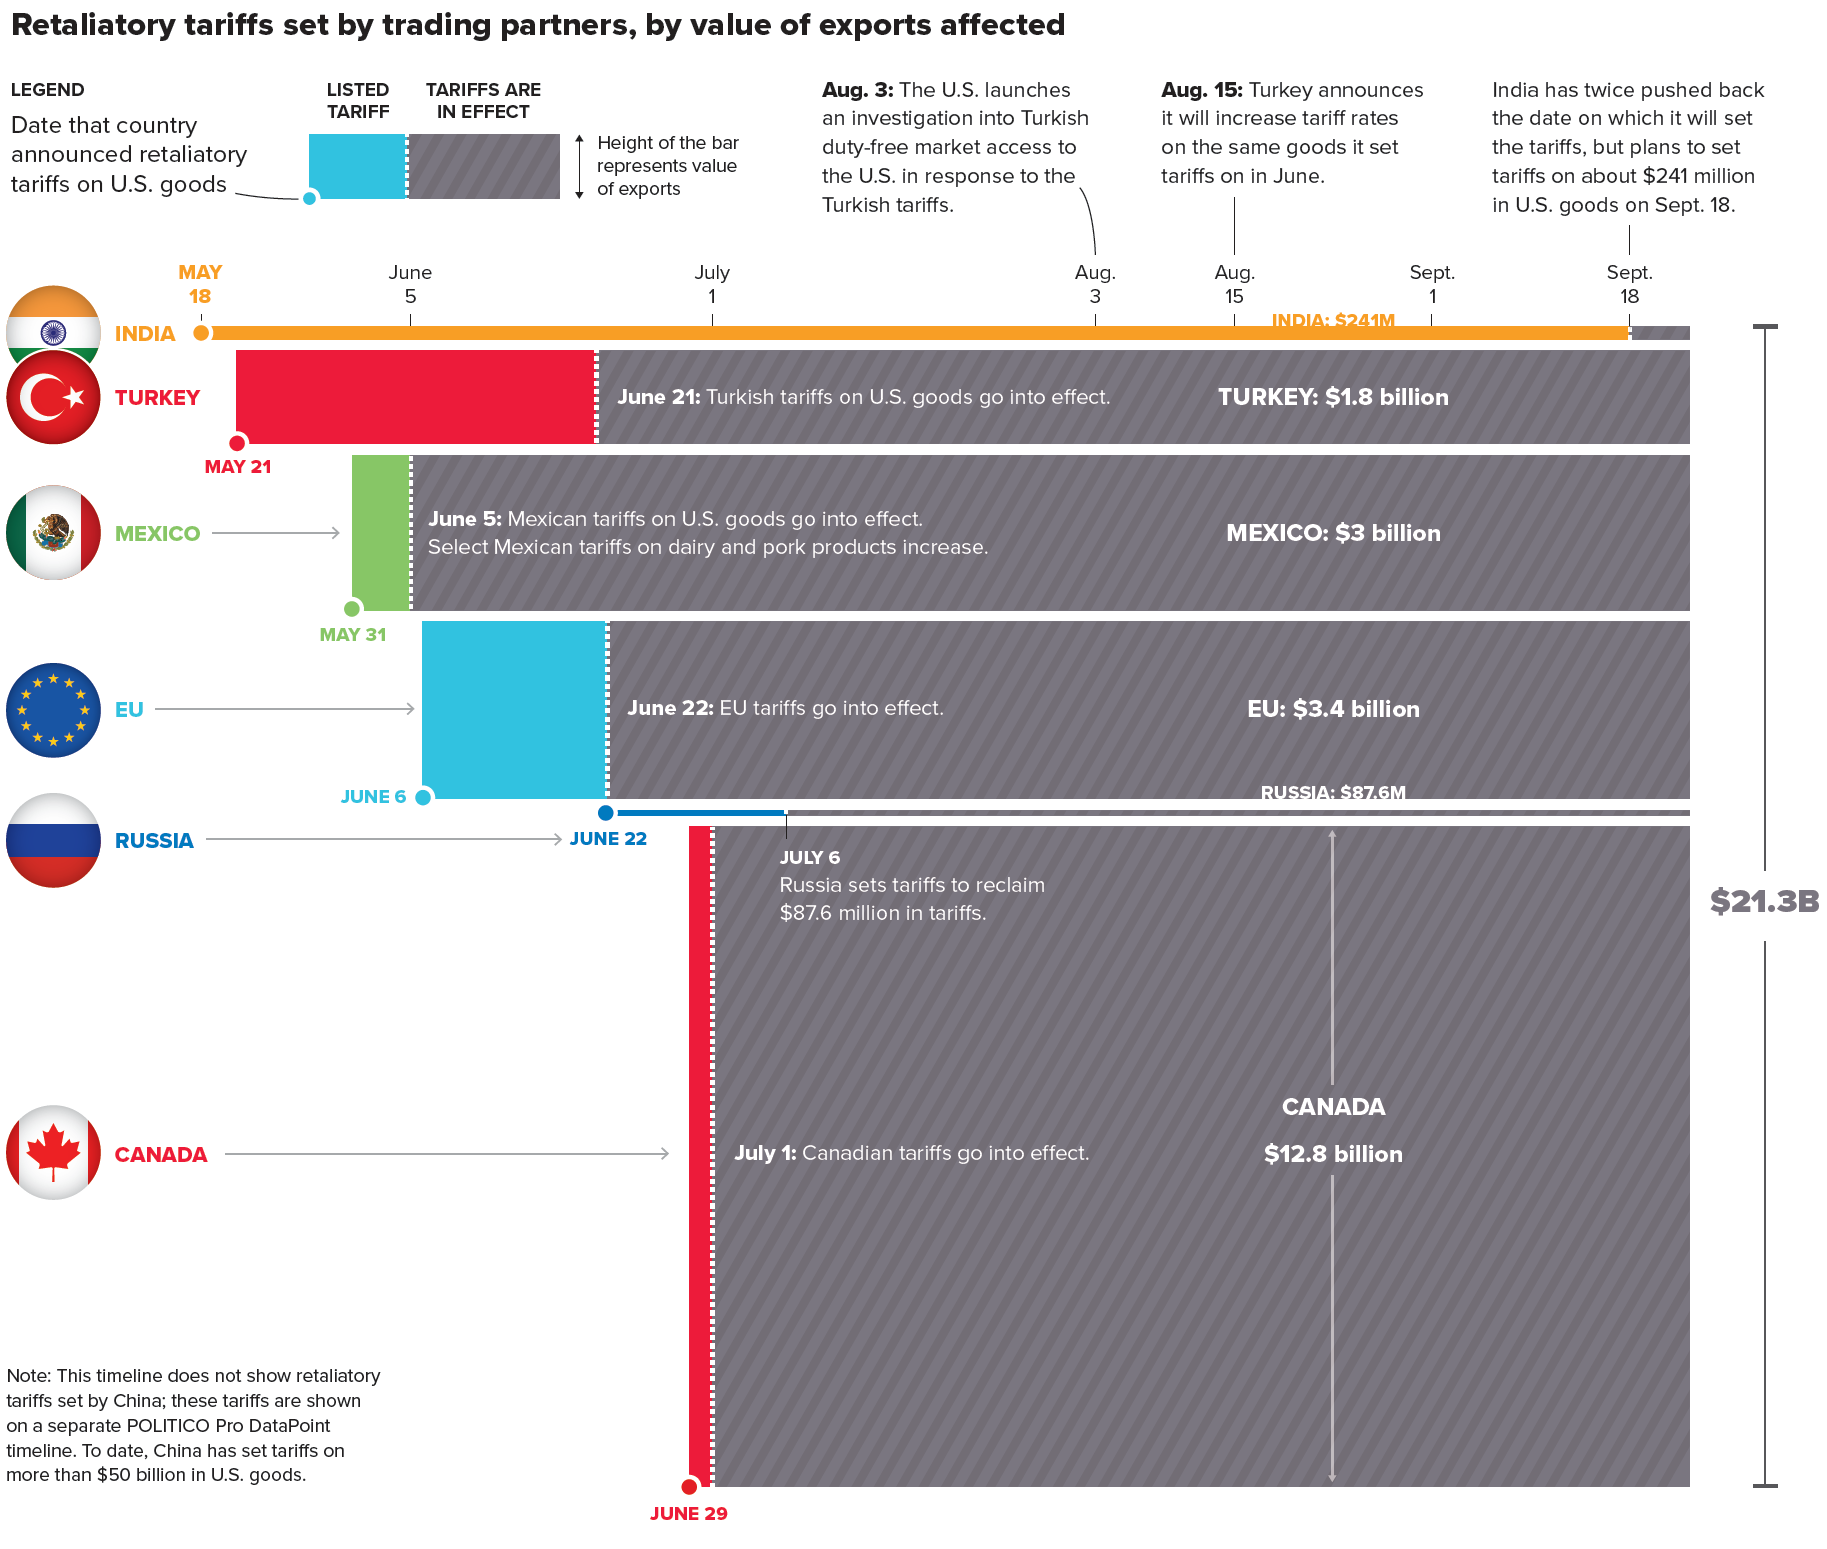
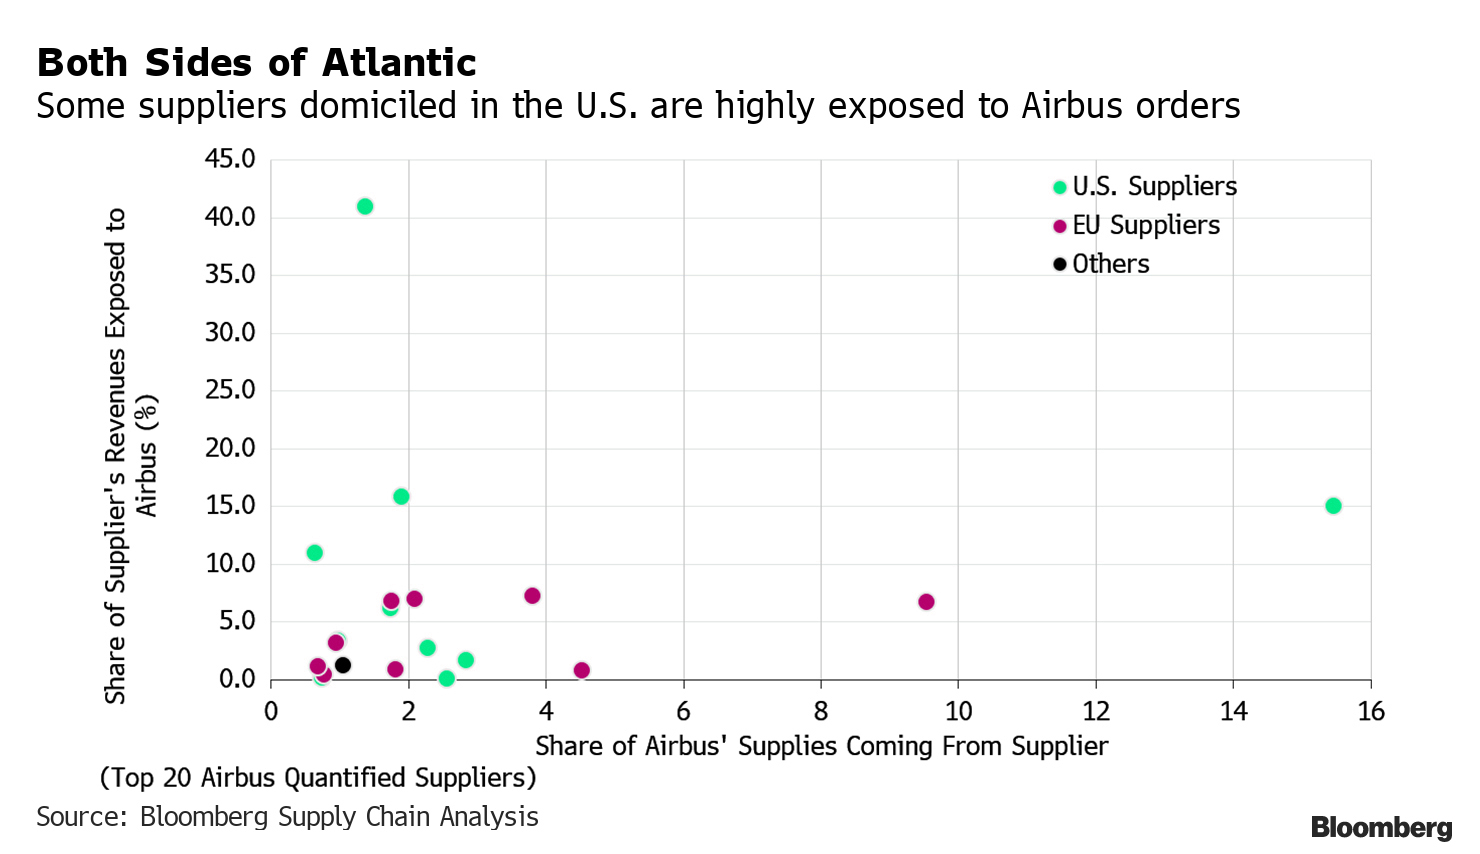 World Trade Organization authorized $7.5 billion in U.S. duties against the EU would hit export orders for U.S. manufacturers, according to Bloomberg Economics.


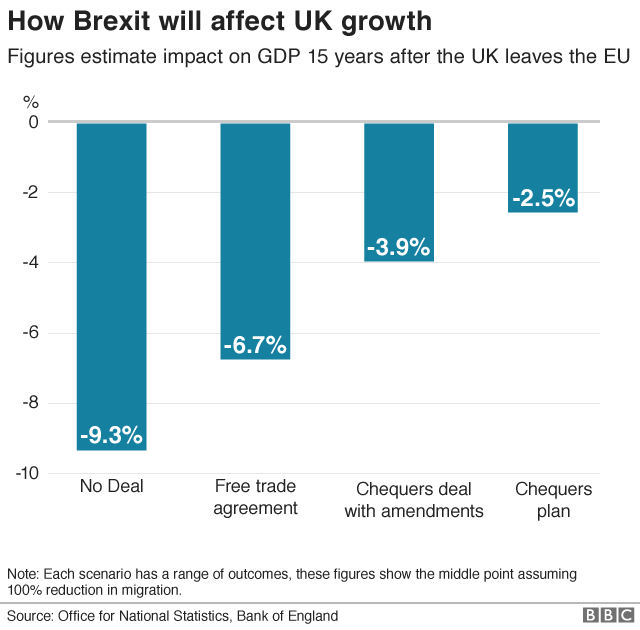
 MIGRATION FALLS WHEN INCOMES RISE
 According to the International Monetary Fund (IMF),


 Source:


 Sources:


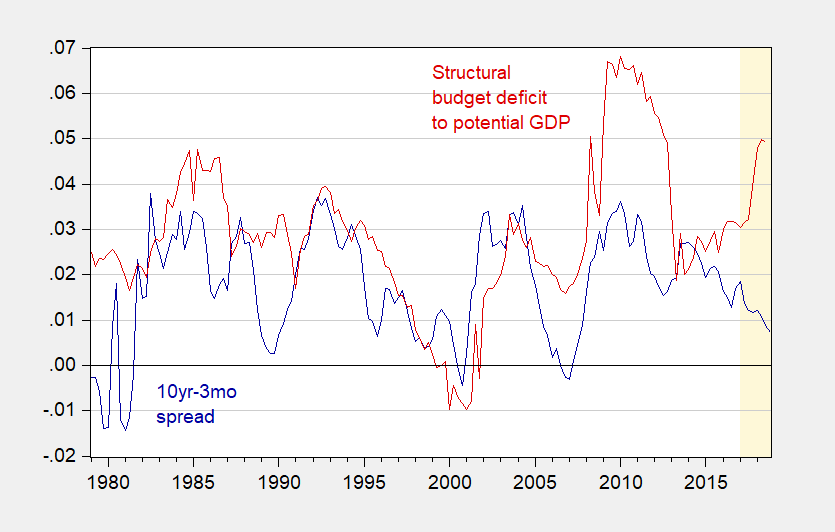 Figure 1: 10 year-3 month Treasury spread (blue), structural budget deficit as a share of potential GDP (red). Orange shading denotes Trump administration. Source: Federal Reserve, CBO, Budget and Economic Outlook, and Chinn’s calculations.
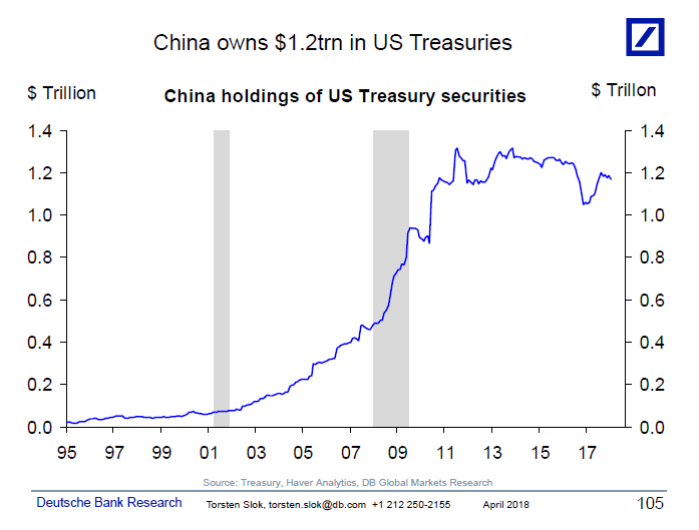
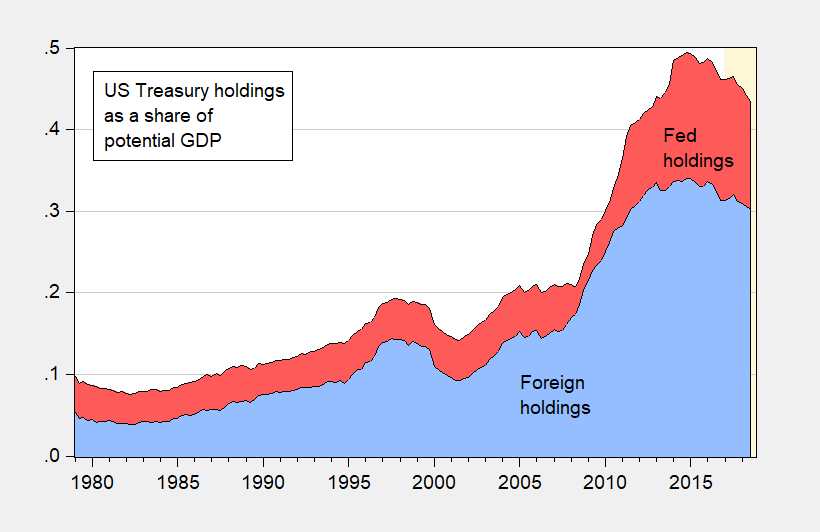 Figure 2: Foreign and international holdings of US Treasurys (blue) and Federal Reserve holdings (red), both as a share of potential GDP. Source: BEA, CBO, and Chinn’s calculations.

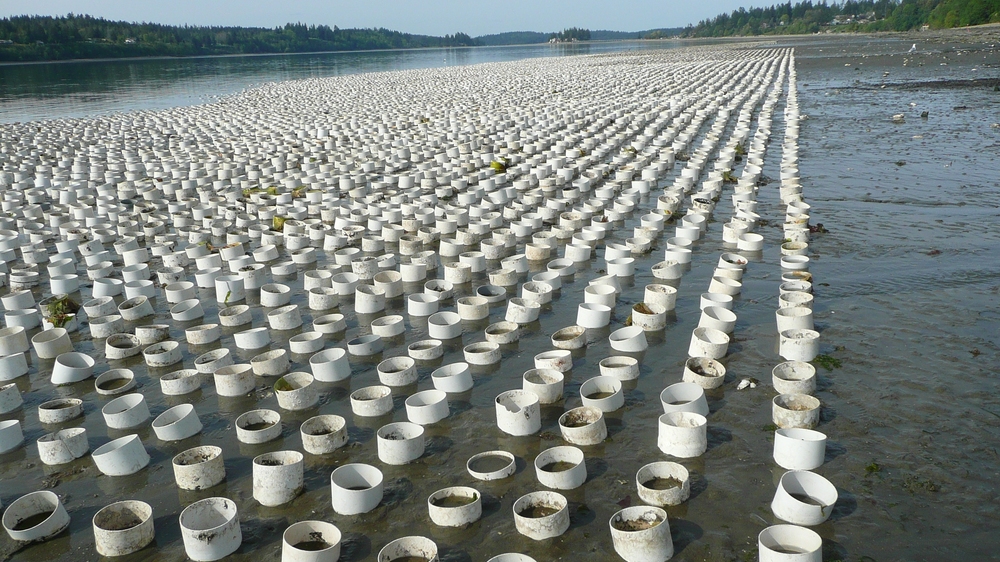
![Toxic Pearl: Pacific Northwest Shellfish Companies' Addiction to Pesticides? by [Perle, M.]](https://images-na.ssl-images-amazon.com/images/I/41yrgTY7ohL.jpg)

 (source)
 (
(


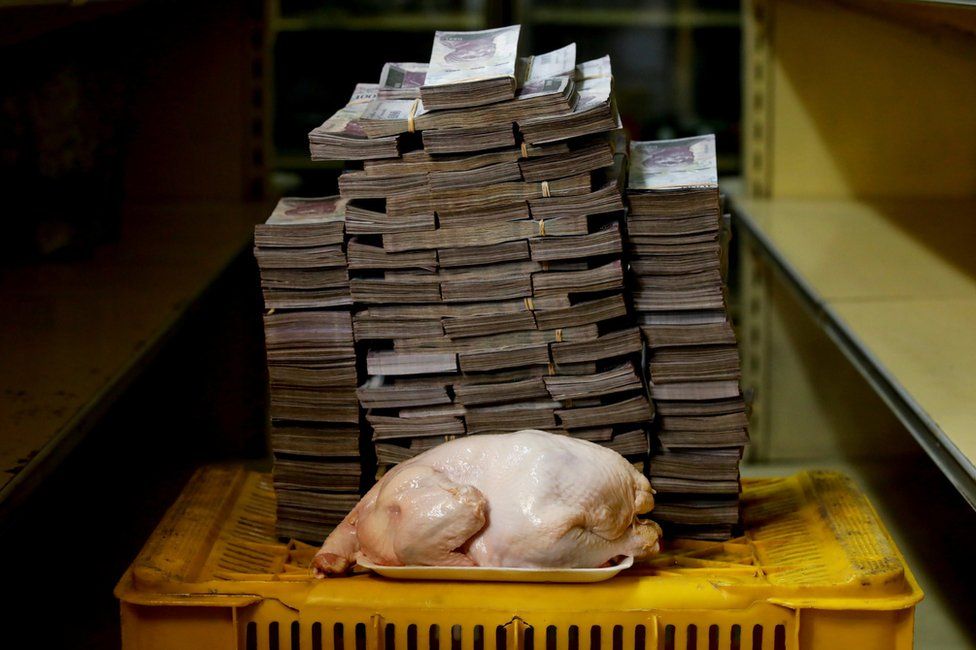
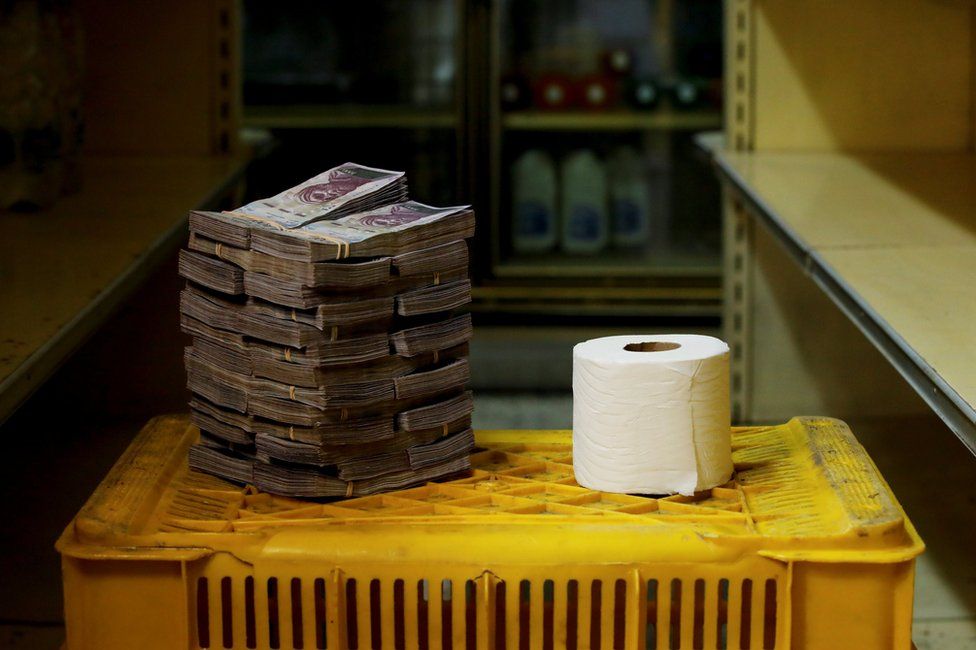 This explains pictures circulating on the web asking people NOT to use banknotes as toilet paper… Also, imagine the volume of money needed to buy a car!


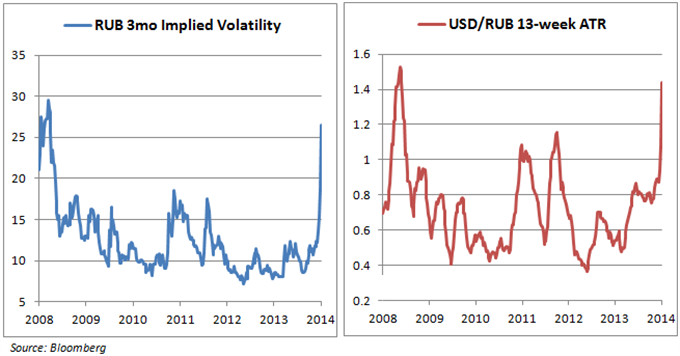
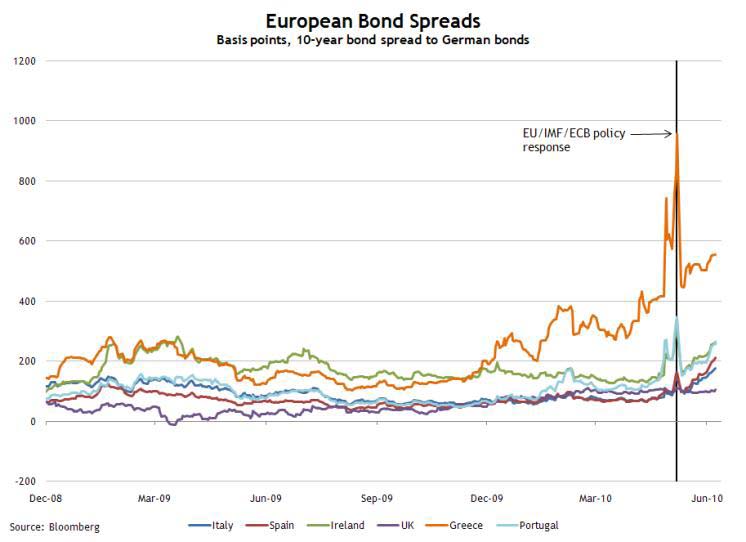
 Source: Bloomberg

 –
–


 Argentina needs some $30bn in standby funds, perhaps more.
 Source:


[2]___Super_Portrait.jpg)
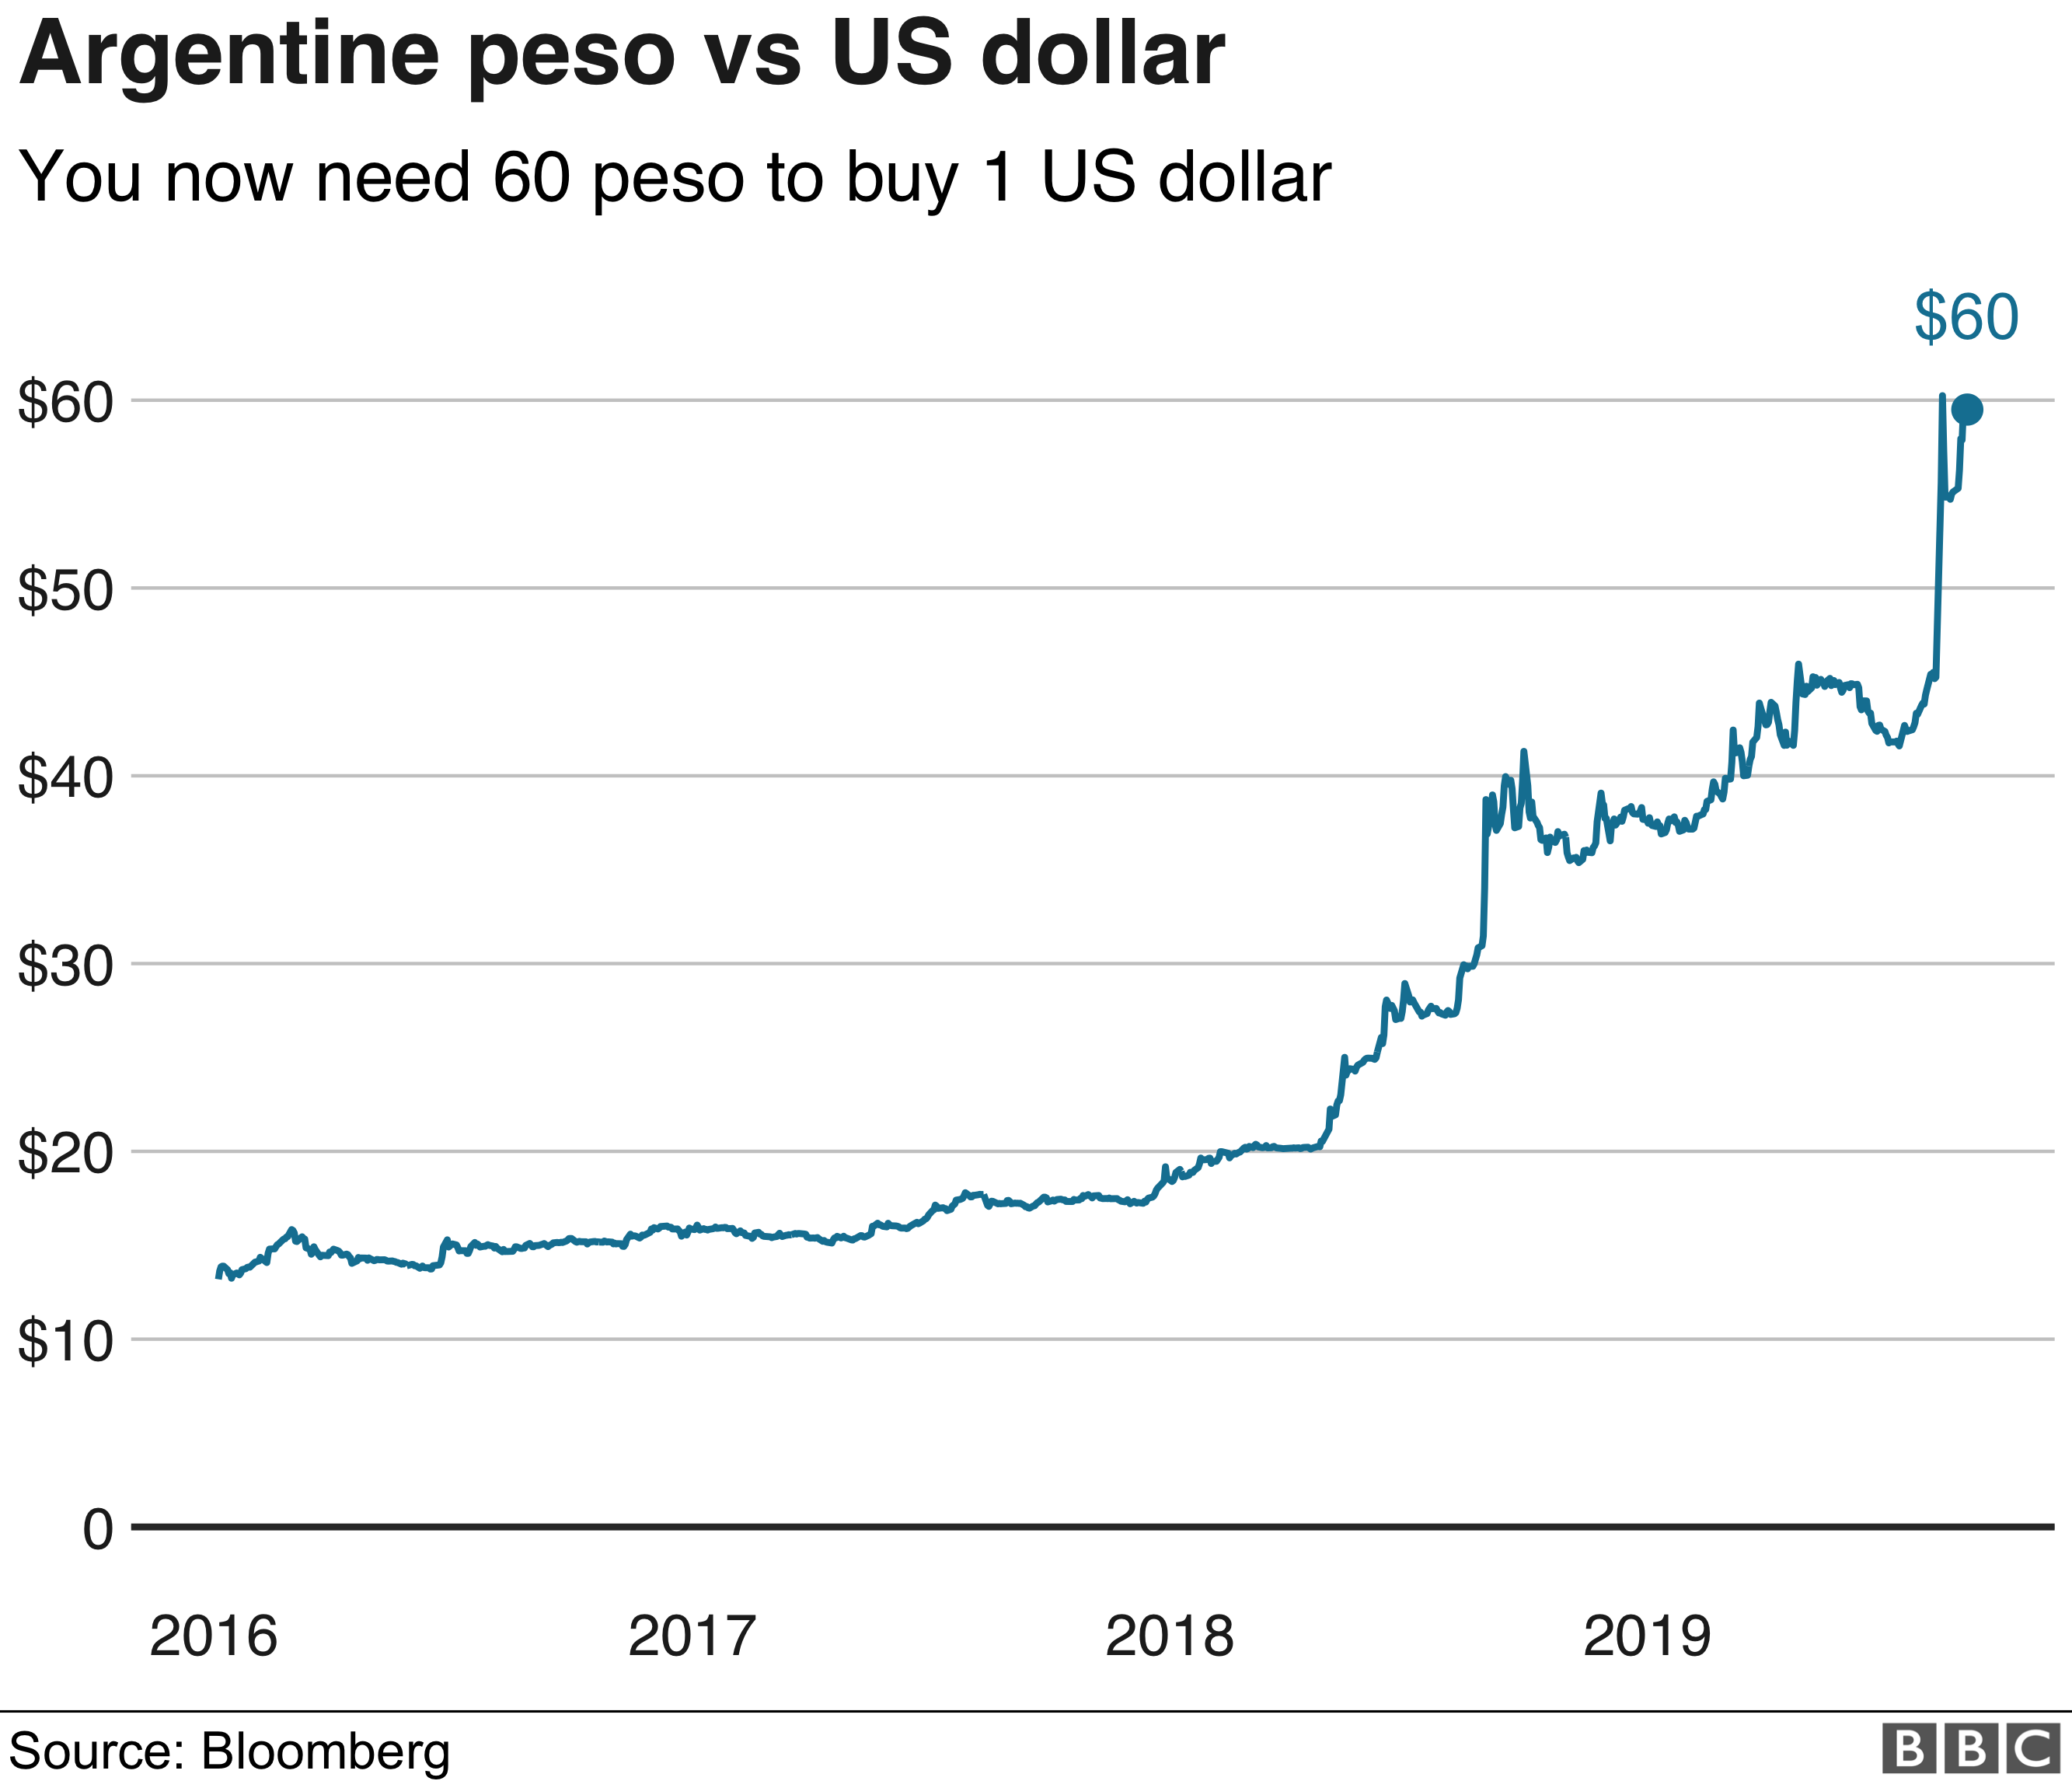
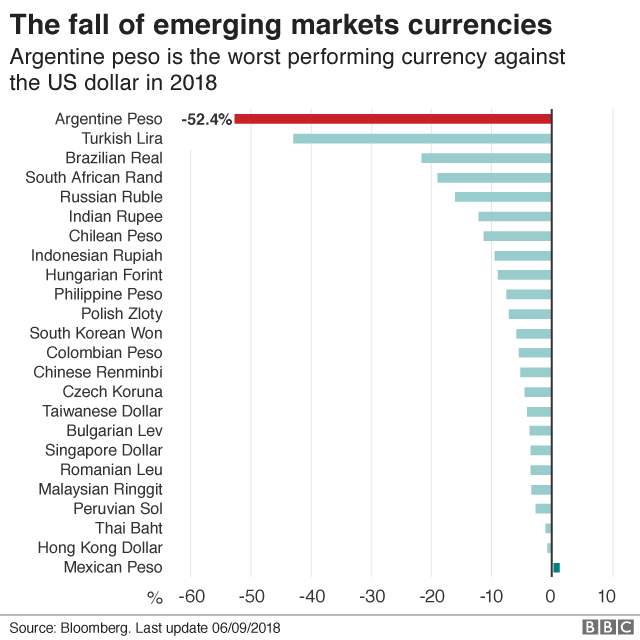
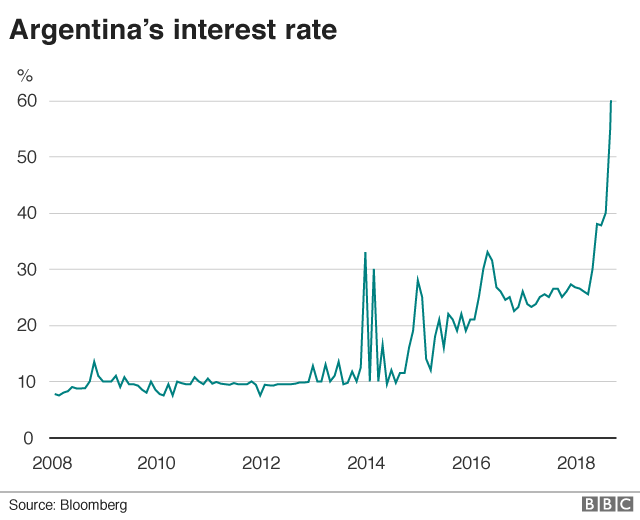
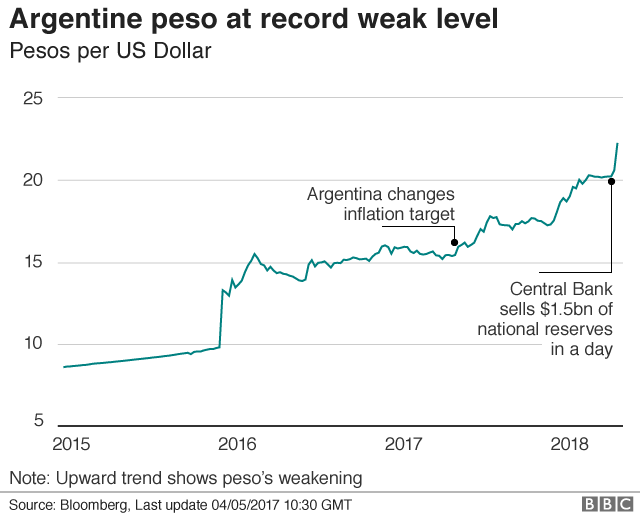
 Things have taken a rather dramatic turn for the worst over the past two weeks. After the central bank hiked rates three times in the space of a week for a total of 1,275 basis points in an effort to arrest the slide in the peso. But that wasn’t enough as the Argentinean Peso (ARS) careened to a new all-time low ahead of another CB rate decision.


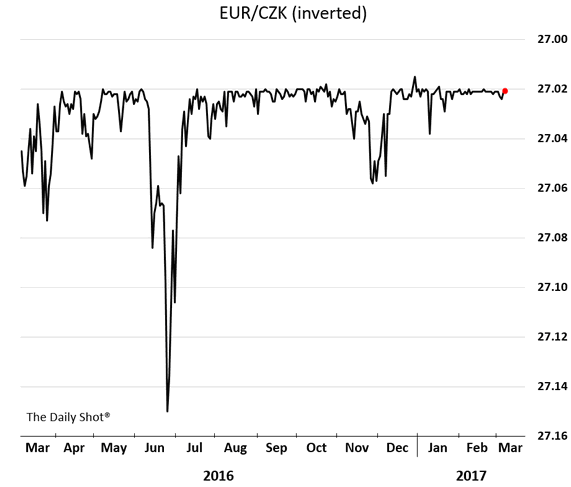 Maintaining a fixed exchange rates implies a cap on the price of foreign currency which has forced the central bank to keep buying euros (and selling koruna) to make sure the koruna doesn’t appreciate above the target level. This policy has resulted in the CNB holding huge amounts of euros.
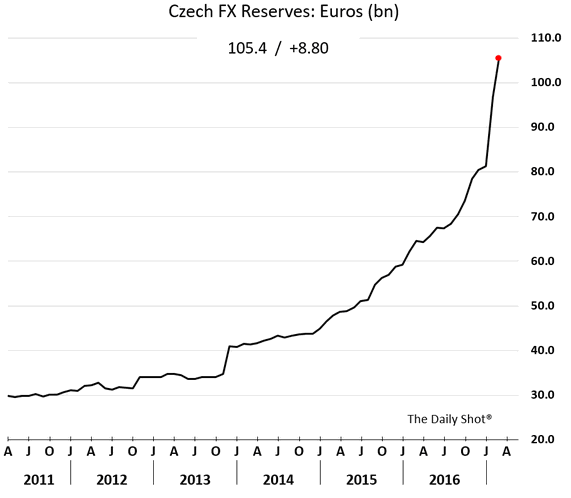
 Source: Goldman Sachs, @joshdigga
 Source: @fastFT
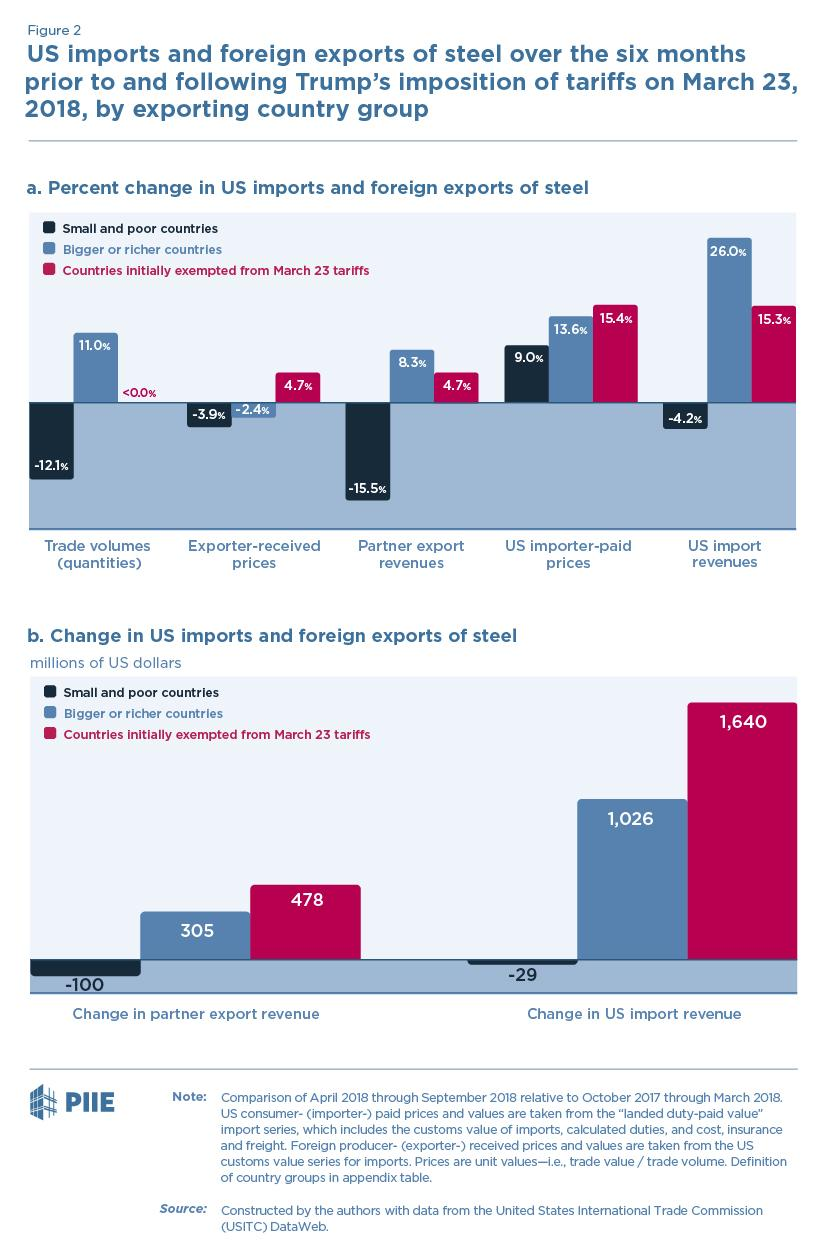
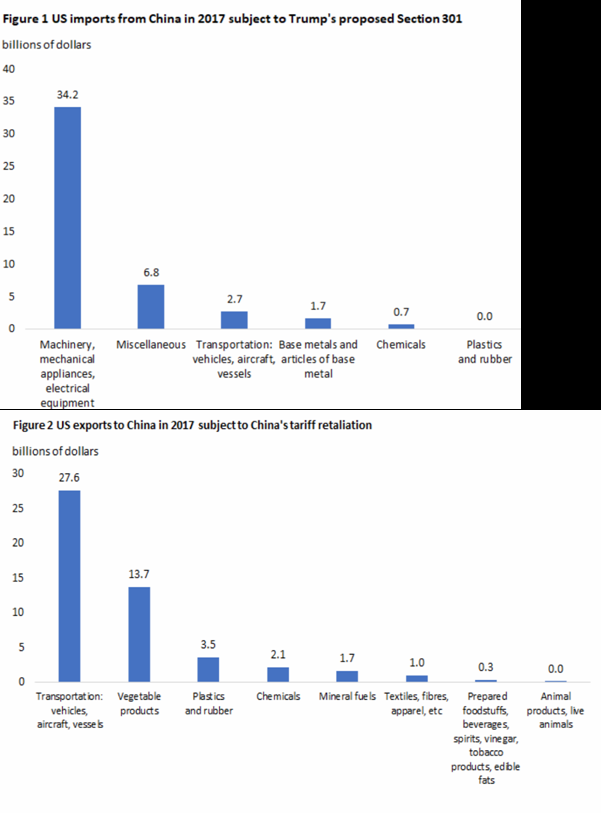
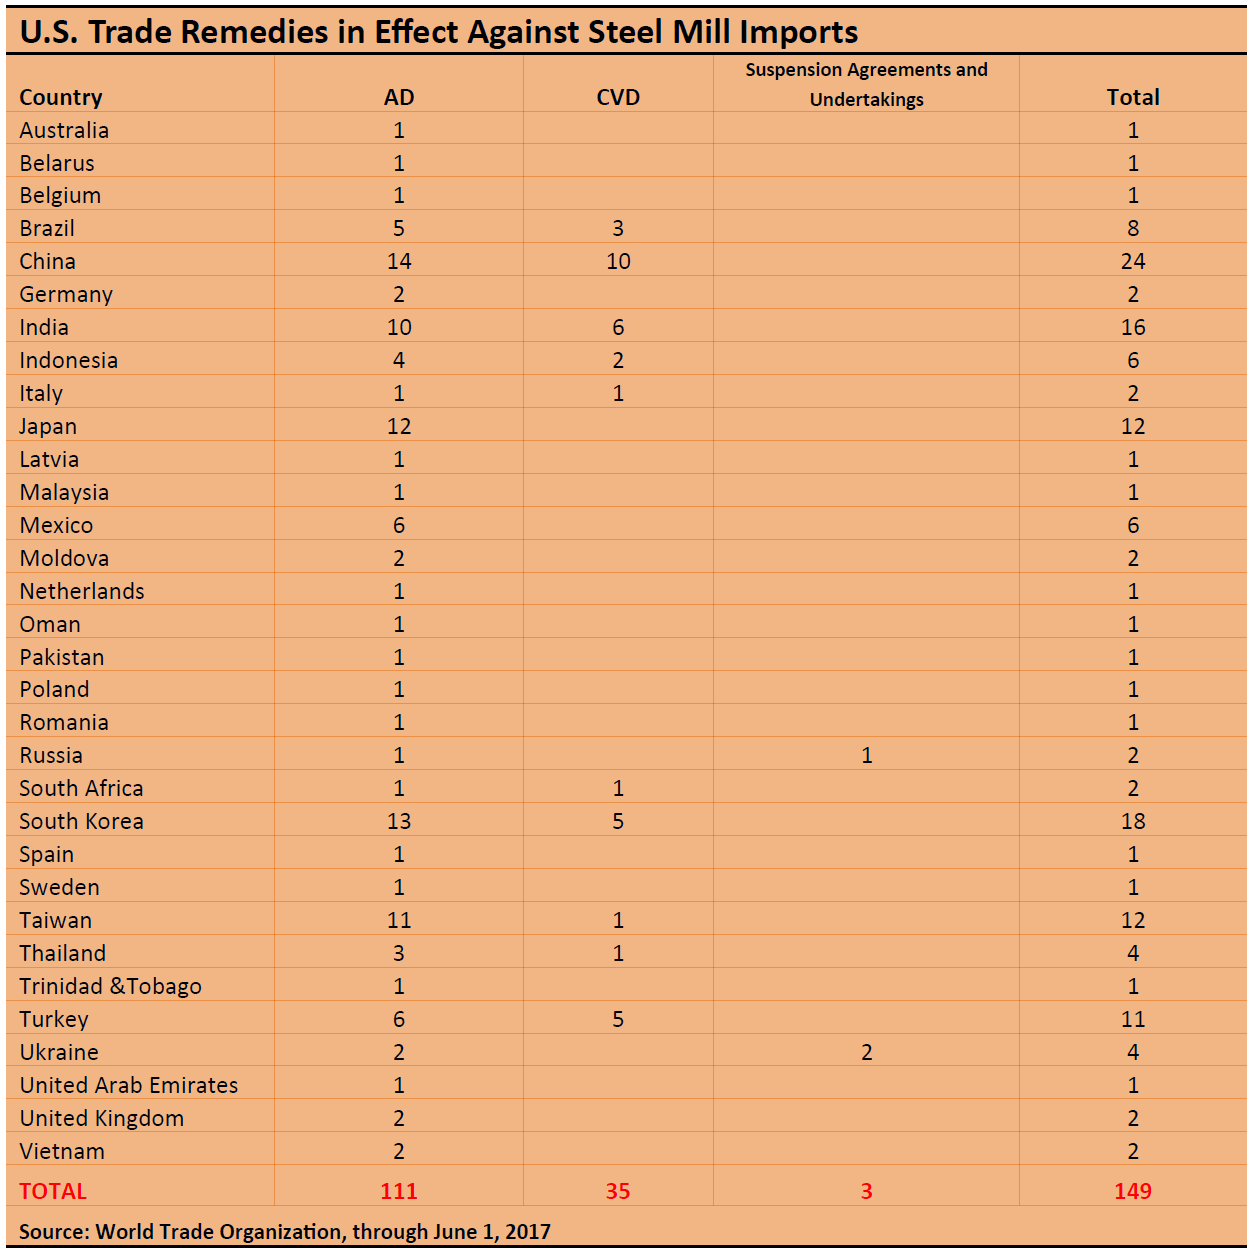
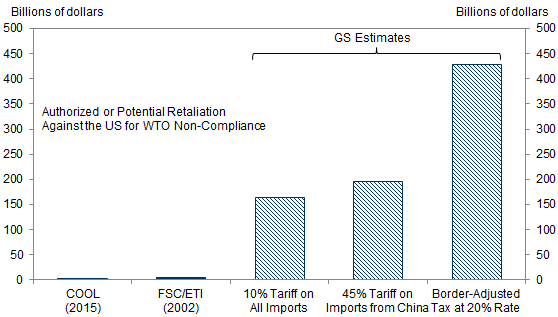 Source:Mericle and Phillips, “US Daily: Trade Disputes: What Happens When You Break the Rules?” Goldman Sachs, February 17, 2017 (not online), based on data from World Trade Organization, Goldman Sachs Global Investment Research.


 It is pretty hard to square those two data points. UK data is from the Office of National Statistics’
  And the UK thinks it sells more services to the U.S. than the U.S. thinks it buys.
 My guess is that such discrepancies are actually common in the services trade numbers. Goods trade is calculated by customs bureaus. Lots of the numbers on services trade come from surveys, estimates, and the like.


.png")


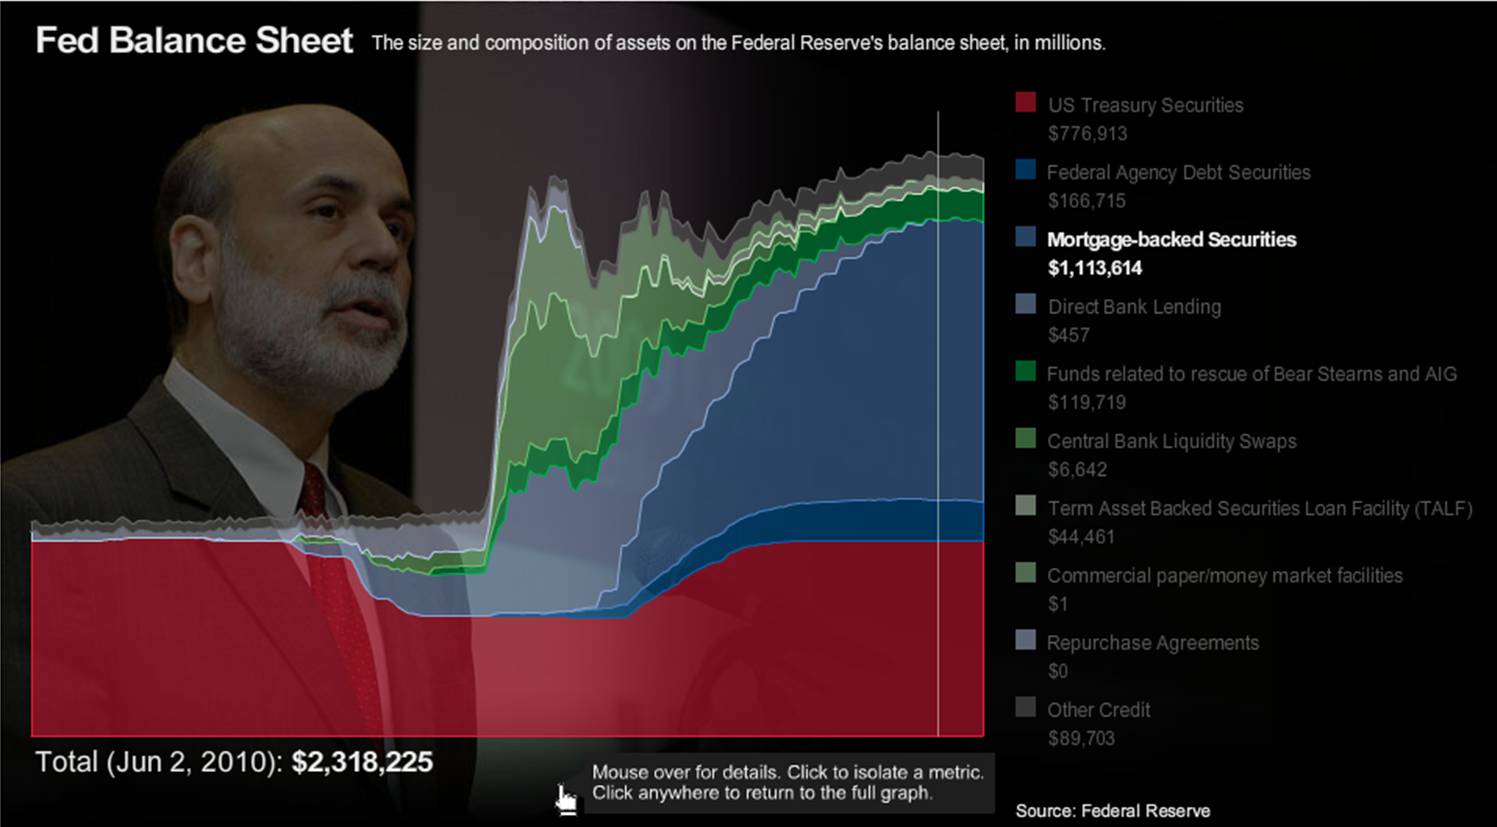


 June 2010")
![[yuan0621]](http://sg.wsj.net/public/resources/images/OB-IY966_yuan06_NS_20100621225415.gif)


![[ABREAST]](http://sg.wsj.net/public/resources/images/MI-BD080_ABREAS_NS_20100502191214.gif)


![[IMF]](http://sg.wsj.net/public/resources/images/WO-AA574_IMF_NS_20100420215204.gif)


![[SUGAR_p1]](http://sg.wsj.net/public/resources/images/P1-AU269A_SUGAR_NS_20100314194814.gif)


![[hourly_wage_cuts_chart.png]](http://2.bp.blogspot.com/_Et4TQ-a0gGU/S5PwzgY6MuI/AAAAAAAAC6k/tGAwpoz7qNk/s1600/hourly_wage_cuts_chart.png "[hourly_wage_cuts_chart.png]")

![[SPAIN_p1]](http://sg.wsj.net/public/resources/images/P1-AT968_SPAIN__NS_20100224184413.gif)


.jpg)


CERNOBBIO – Investors and economic observers have begun to ask the same question that I posed in an article published 18 years ago: “Who lost Argentina?” In late 2001, the country was in the grips of an intensifying blame game, and would soon default on its debt obligations, fall into a deep recession, and suffer a lasting blow to its international credibility. This time around, many of the same contenders for the roles of victim and accuser are back, but others have joined them. Intentionally or not, all are reprising an avoidable tragedy.
After a poor primary-election outcome, Argentinian President Mauricio Macri finds himself running for another term under economic and financial conditions that he promised would never return. The country has imposed capital controls and announced a reprofiling of its debt payments. Its sovereign debt has been downgraded deeper into junk territory by Moody’s, and to selective default by Standard & Poor’s. A deep recession is underway, inflation is very high, and an increase in poverty is sure to follow.
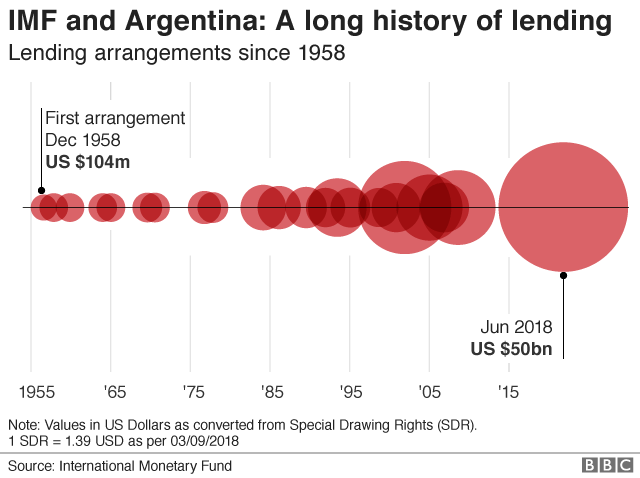
It has not even been four years since Macri took office and began pursuing a reform agenda that was widely praised by the international community. But since then, the country has run into trouble and become the recipient of record-breaking support from the International Monetary Fund.
Argentina has fallen back into crisis for the simple reason that not enough has changed since the last debacle. As such, the country’s economic and financial foundations have remained vulnerable to both internal and external shocks.
Although they have been committed to an ambitious reform program, Argentina’s economic and financial authorities have also made several avoidable mistakes. Fiscal discipline and structural reforms have been unevenly applied, and the central bank has squandered its credibility at key moments.
More to the point, Argentinian authorities succumbed to the same temptation that tripped up their predecessors. In an effort to compensate for slower-than-expected improvements in domestic capacity, they permitted excessive foreign-currency debt, aggravating what economists call the “original sin”: a significant currency mismatch between assets and liabilities, as well as between revenues and debt servicing.
Worse, this debt was underwritten not just by experienced emerging-market investors, but also by “tourist investors” seeking returns above what was available in their home markets. The latter tend to lack sufficient knowledge of the asset class into which they are venturing, and thus are notorious for contributing to price overshoots – both on the way up and the way down.
Undeterred by Argentina’s history of chronic volatility and episodic illiquidity – including eight prior defaults – creditors gobbled up as much debt as the country and its companies would issue, including an oversubscribed 100-year bond that raised $2.75 billion at an interest rate of just 7.9%. In doing so, they drove the yields of Argentine debt well below what economic, financial, and liquidity conditions warranted, which encouraged Argentine entities to issue even more bonds despite the weakening fundamentals.
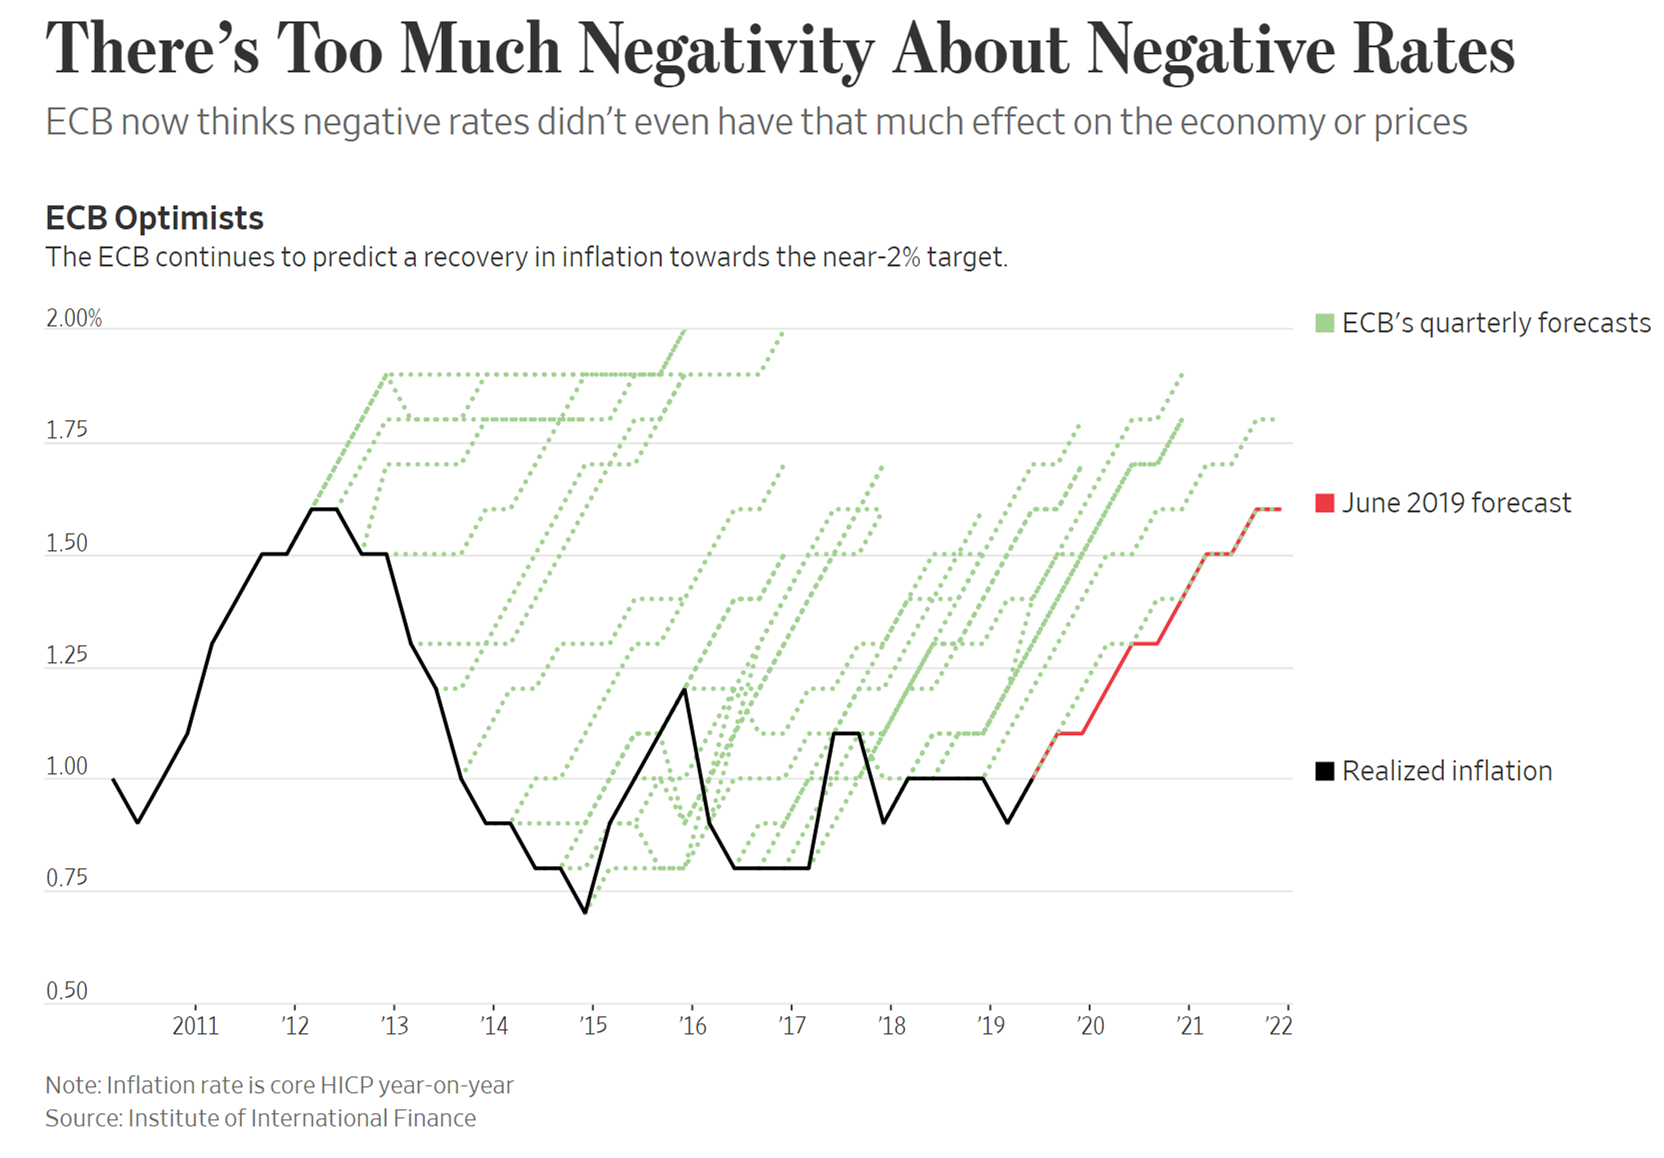
The search for higher yields has been encouraged by unusually loose monetary policies – ultra-low (and, in the case of the European Central Bank, negative) policy rates and quantitative easing – in advanced economies. Systemically important central banks (the Bank of Japan, the US Federal Reserve, and the ECB) thus have become the latest players in the old Argentine blame game.
Moreover, influenced by years of strong central-bank support for asset markets, investors have been conditioned to expect ample and predictable liquidity – a consistent “common global factor” – to compensate for all sorts of individual credit weaknesses. And this phenomenon has been accentuated by the proliferation of passive investing, with the majority of indices heavily favoring outstanding market values (hence, the more debt an emerging market issues, like Argentina, the higher its weight in many indices becomes).
Then there is the IMF, which readily stepped in once again to assist Argentina when domestic-policy slippages made investors nervous in 2018. So far, Argentina has received $44 billion under the IMF’s largest-ever funding arrangement. Yet, since day one, the IMF’s program has been criticized for its assumptions about Argentina’s growth prospects and its path to longer-term financial viability. As it happens, the same issues plagued the IMF’s previous efforts to Argentina, including in the particularly messy lead-up to the 2001 default.
As in Agatha Christie’s Murder on the Orient Express, almost everyone involved has had a hand in Argentina’s ongoing economic and financial debacle, and all are victims themselves, having suffered reputational harm and, in some cases, financial losses. Yet those costs pale in comparison to what the Argentine people will face if their government does not move quickly – in cooperation with private creditors and the IMF – to reverse the economic and financial deterioration.
Whoever prevails at next month’s presidential election, Argentina’s government must reject the notion that its only choice is between accepting and refusing all demands from the IMF and external creditors. Like Brazil under then-President Luis Inácio Lula da Silva in 2002, Argentina needs to embark on a third path, by developing a homegrown adjustment and reform program that places greater emphasis on protecting the most vulnerable segments of society. With sufficient buy-in from domestic constituencies, such a program would provide an incentive-aligned path for Argentina to pursue its recovery in cooperation with creditors and the IMF.
Given the downturn in the global economy and the rising risk of global financial volatility, there is no time to waste. Everyone with a stake in Argentina has a role to play in preventing a repeat of the depression and disorderly default of the early 2000s. Managing a domestic-led recovery will not be easy, but it is achievable – and far better than the alternatives.”