Washington state - maps and data
Here are preliminary maps and graphs that provide statewide information or combine data for the Puget Sound region.
The links below lead to three pages featuring different kinds of maps, lists, and information that show the prevalence of restrictive covenants. We will be adding additional information in the months ahead.
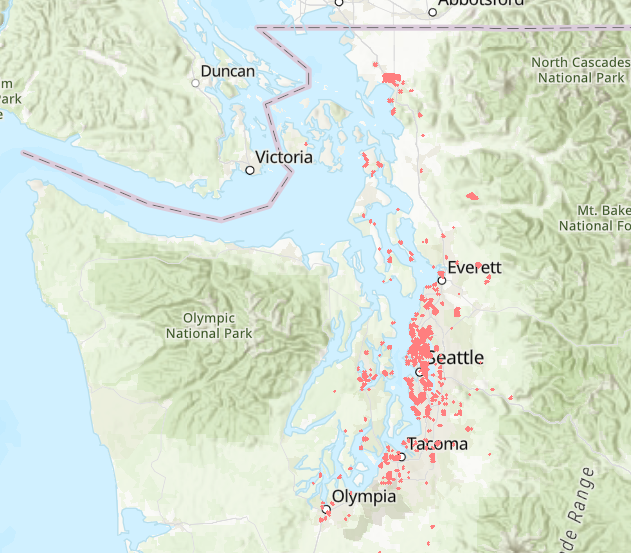
Puget Sound restricted properties
This map shows more than 46,000 properties in seven Puget Sound counties that carried racist deed restrictions preventing persons of color from owning, renting, or occupying. Zoom and pan for a closer look. Click on any parcel to see the restriction.
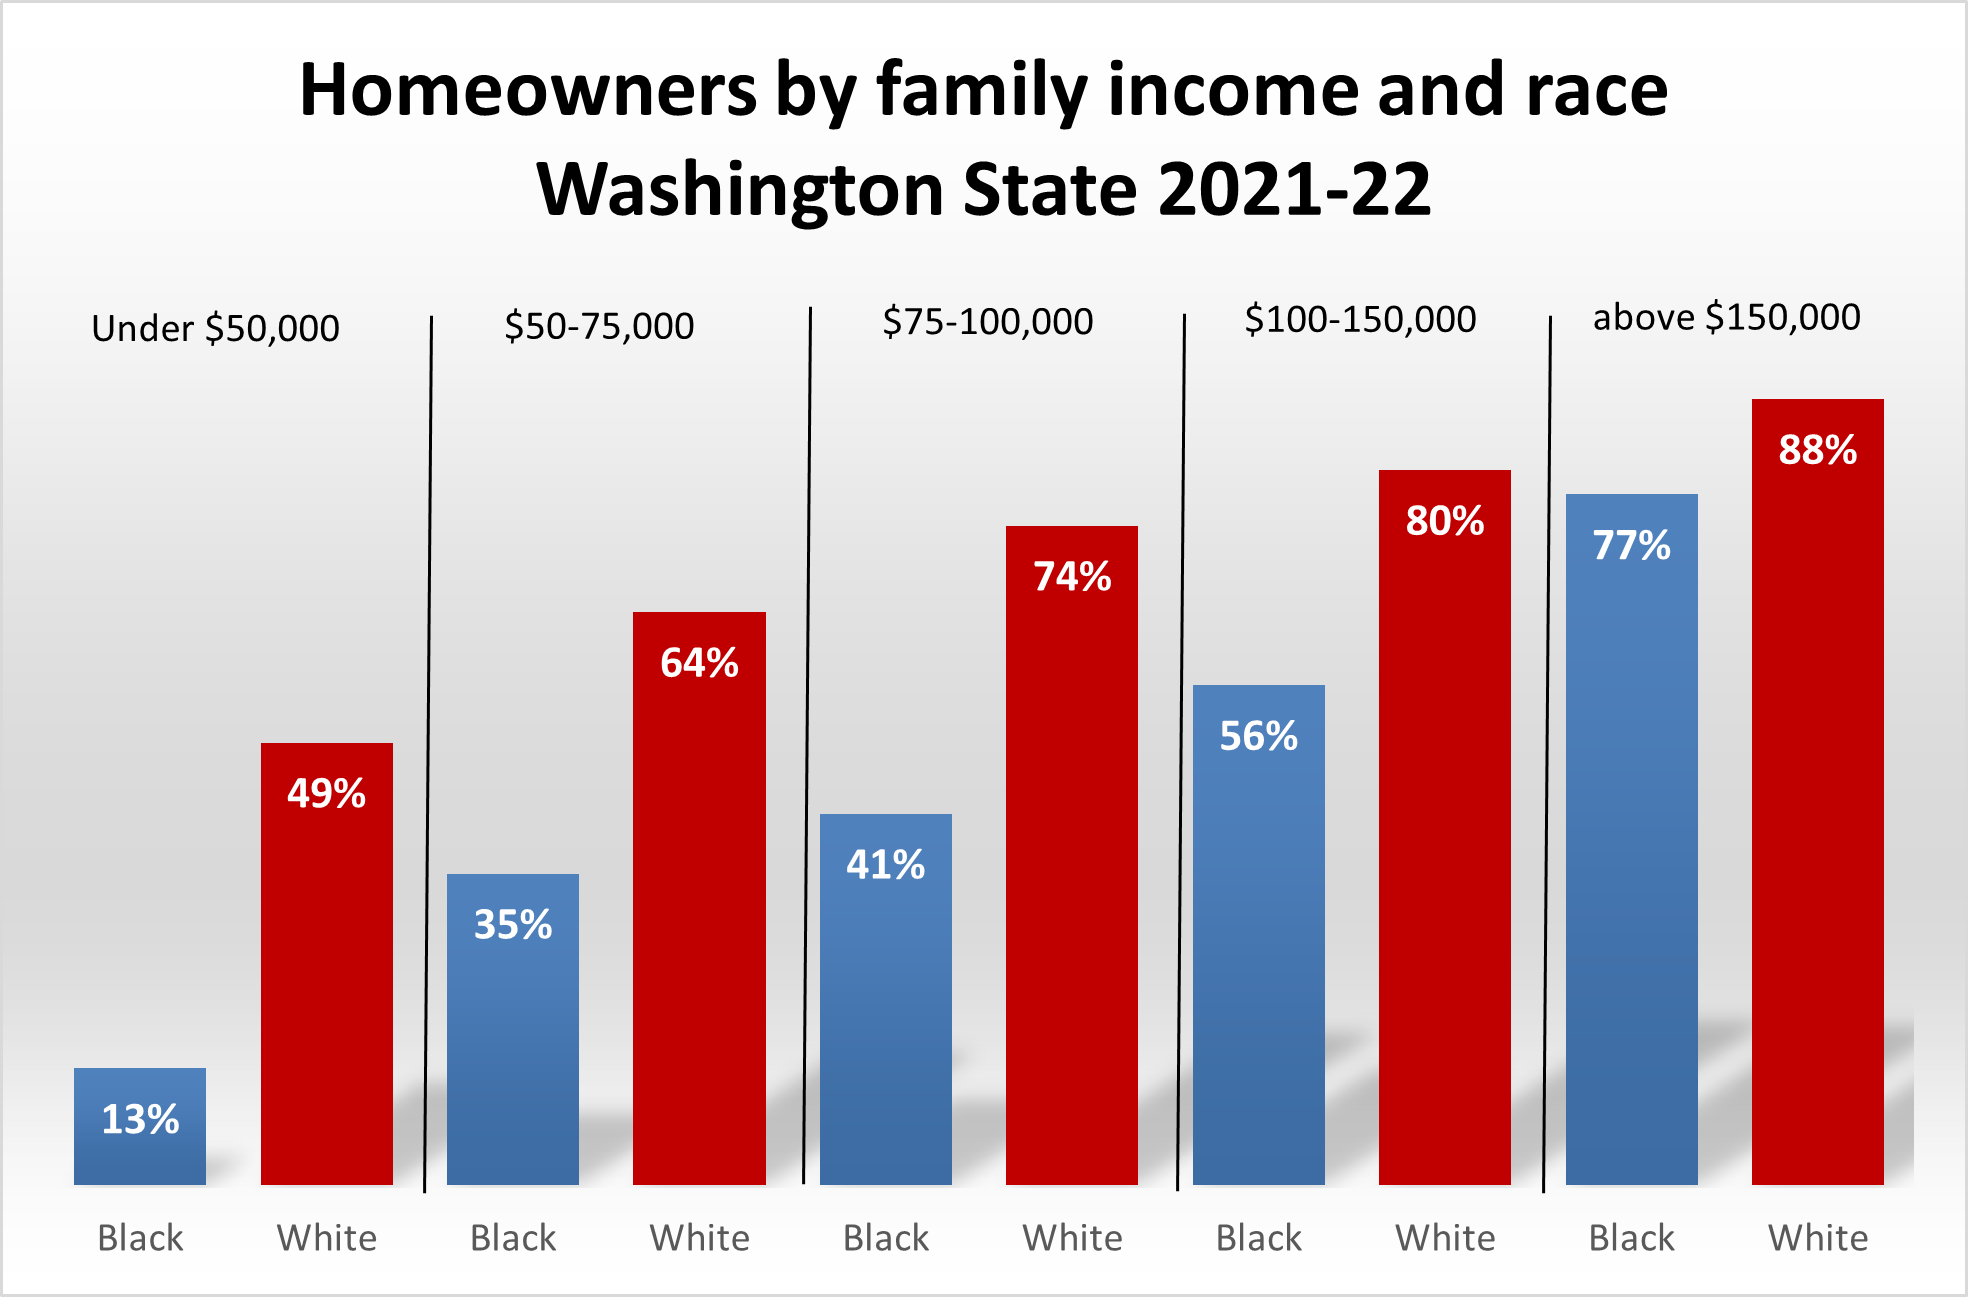
Homeownership by race 1970-2022 - Washington State
In 2018, 69% of White families were homeowners compared to only 34% of Black families. Here we track homeownership rates since 1970, showing the alarming disparity in the value of homes and ownership rates.
Explore
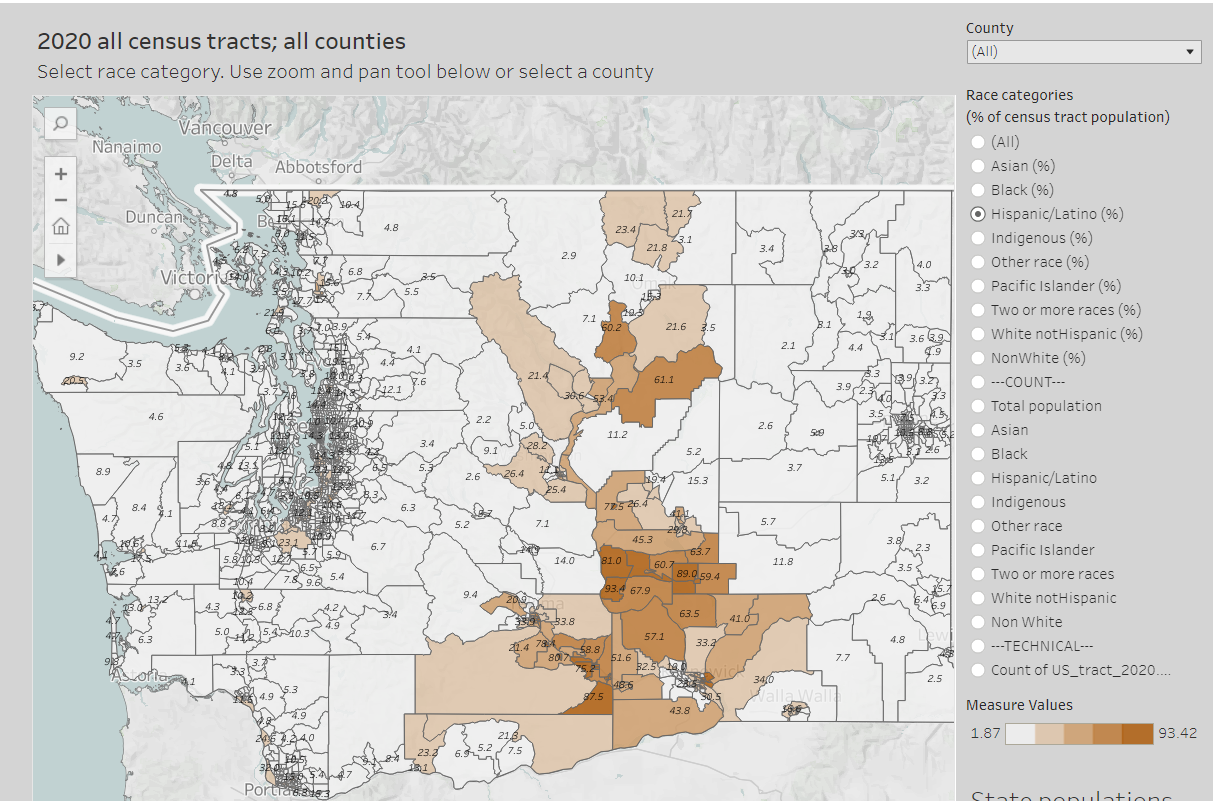
Race and segregation maps
1980-2020
Here we map the neighborhood-by-neighborhood distributions of African Americans, Asian Americans, Indigenous Americans, Latinos, and Whites across four decades.