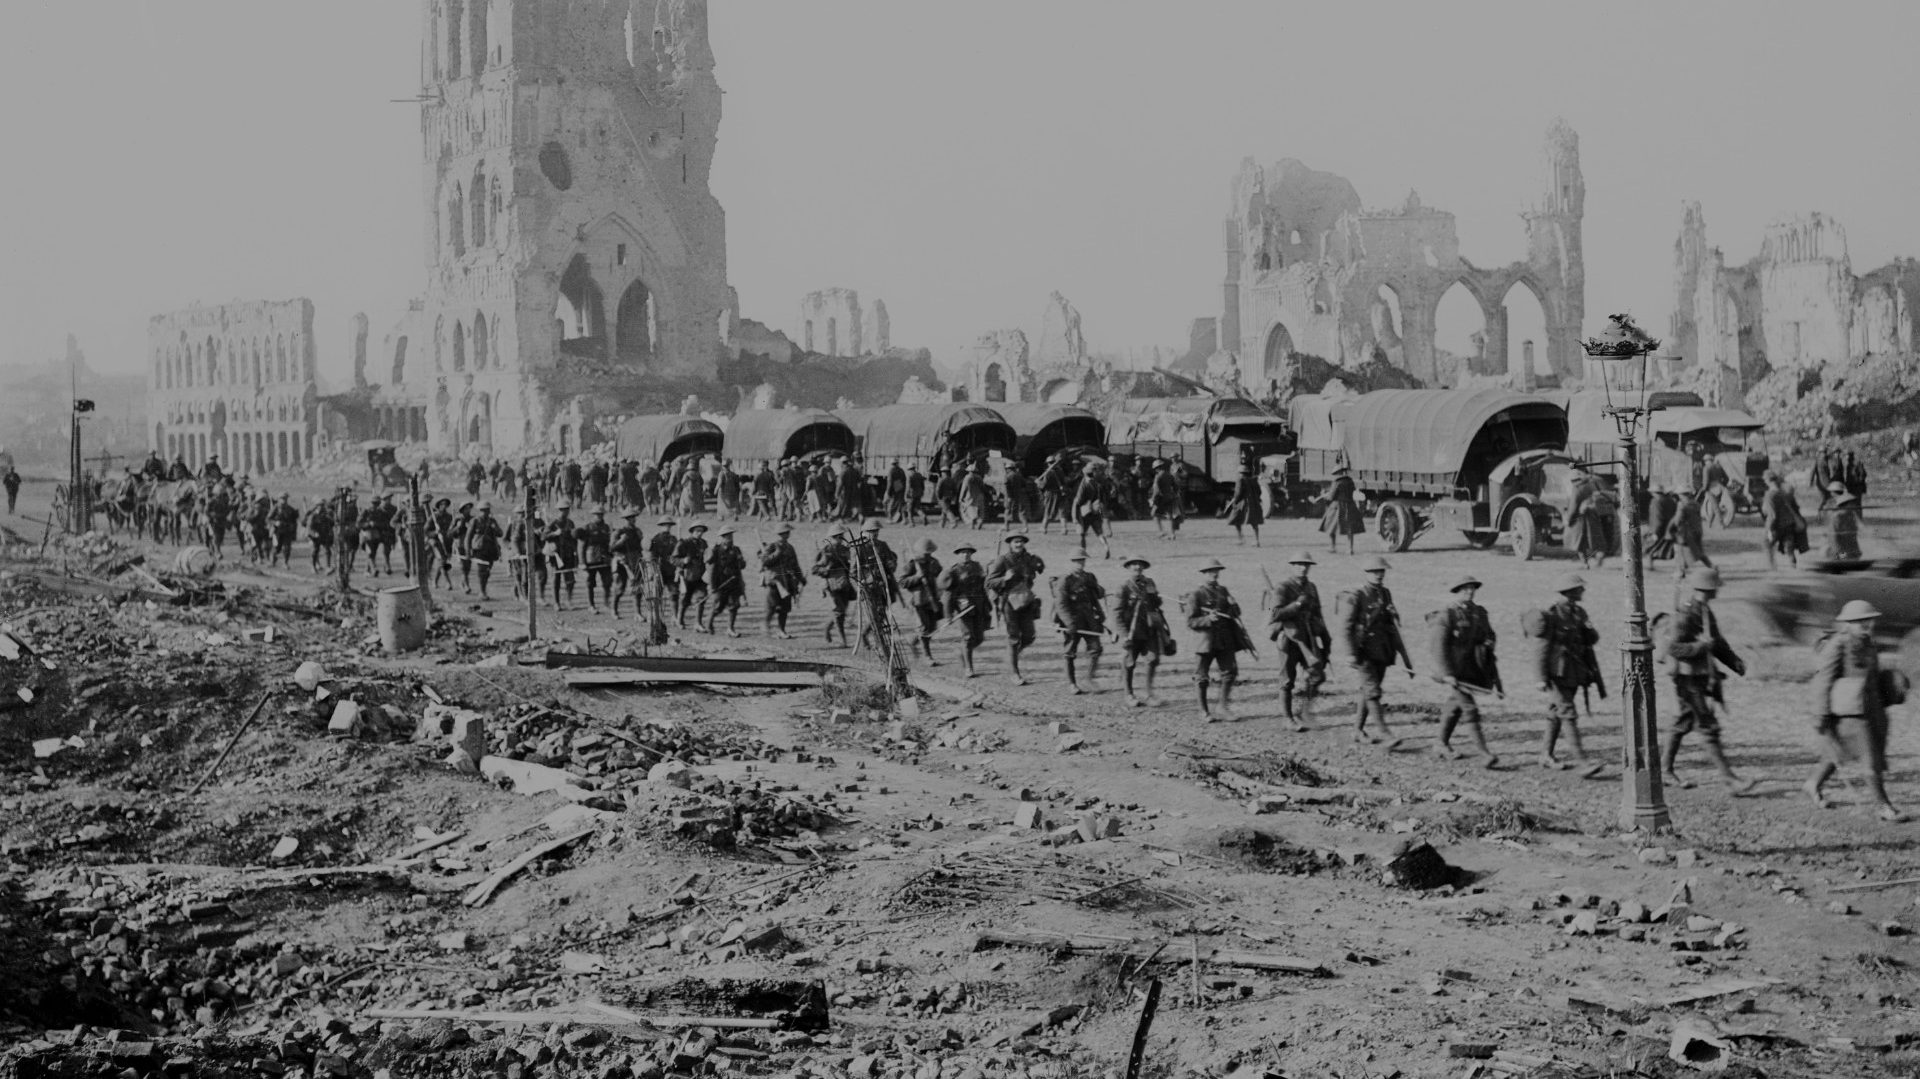
Throughout the course, students work on a digital project of their own design that examines the history of the First or Second World War. No prior knowledge of digital tools or digital humanities is required. Absolute beginners are welcome and encouraged. At the same time, people who already have digital skills are just as welcome and will find much that is new to them. Your project will be in one of two areas (you pick): (a) a data science project (data visualization or analysis) or b) a public-facing digital project.
We’ll get you up to speed on digital humanities and tools, as well as on conceptual issues about history and the digital humanities (like, what gets into digital archives and what doesn’t?), in the three workshops.
For your final project in the class, you must pick a genre of project. (People who are using the class to count towards their data science minor are strongly encouraged to do the data science final project.) Your choices are:
- A podcast of no fewer than 7 minutes and no more than 12 minutes, crafted in Audacity. (Podcasts are public-facing.) It may include historical sound clips or an interview if that’s possible.
- A data science project of some kind, plus a report (or public-facing presentation, such as on a website) that summarizes the project and results. You might use Voyant or Google Maps, or another tool or tools. We define “a data science project of some kind” as: a) a project that draws on a substantial data set that’s about WWI and/or WWII, which you built and cleaned, or which someone else built and cleaned and made open source; plus b) a project that uses a digital tool, be it Voyant, Google Maps, Excel, Python, etc., to ask some good, historical questions of that data set, and then has some answers to those questions. You must also write a report on what you found. The report can be for the instructors and TAs, not for the general public, and can be in the form of a memo or paper of between 1-2 double-spaced pages. Alternatively, you can build a public presentation of your project — for example, if you make a map, you can build a website to present and contextualize it.
More information about both project options is available on Canvas.
