|

|
|
Initiation of liquefaction |
||||
To understand how soil liquefaction is initiated, some basic soil mechanics concepts are important. They are briefly described below. For a more thorough explanation, see the references. |
||||
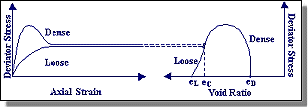
Critical Void Ratio In 1936, Dr. Arthur Casagrande performed a series of drained strain-controlled triaxial tests and discovered that initially loose and dense specimens at the same confining pressure approached the same density when sheared to large strains. The void ratio corresponding to this density was called the critical void ratio (ec). |
||||
|
||||
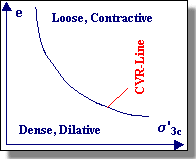
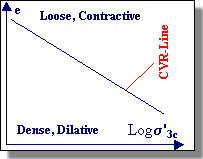
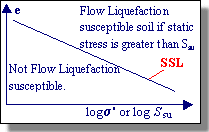
| Performing tests at various effective confining pressures, Casagrande found that the critical void ratio varied with effective confining pressure. Plotting these on a graph produced a curve which is referred to as the critical void ratio (CVR) line. The CVR line constituted the boundary between dilative and contractive behavior in drained triaxial compression. A soil in a state that plots above the CVR line exhibits contractive behavior and vice versa (see figure below). | ||||
|
||||
|
Steady State of Deformation
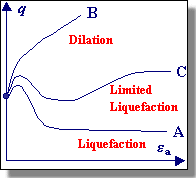
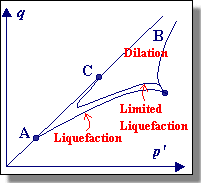
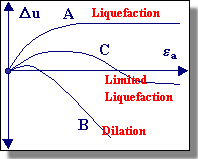
In the mid-1960s, Gonzalo Castro, a student of Casagrande, performed an important series of undrained, stress-controlled triaxial tests. Castro observed three different types of stress-strain behavior depending upon the soil state. Dense specimens initially contracted but then dilated with increasing effective confining pressure and shear stress. Very loose samples collapsed at a small shear strain level and failed rapidly with large strains. Castro called this behavior "liquefaction" - it is also commonly referred to as flow liquefaction. Medium dense soils initially showed the same behavior as the loose samples but, after initially exhibiting contractive behavior, the soil "transformed" and began exhibiting dilative behavior. Castro referred to this type of behavior as "limited liquefaction". |
||||
|
||||
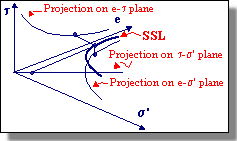
| Castro plotted the relationship (see figure below) between effective confining pressure and void ratio at large strains for these undrained, stress-controlled tests. Castro referred to the curved produced by this plot, which is similar to the CVR line for the drained strain controlled tests performed by Casagrande, as the Steady State Line (SSL). The difference between the CVR and SSL was attributed to the existence of what Casagrande called a "flow structure", in which the grains orient themselves so the least amount of energy is lost by frictional resistance during flow. | ||||
|
||||
| As seen above, the SSL is actually a 3-dimensional curve in e- s'-t space. Using the 2-D projection on the e-s' plane (see figure above), one can determine if a soil is susceptible to flow liquefaction. Soils in an initial state that plots below the SSL are not susceptible to flow liquefaction whereas soils plotting above the SSL are susceptible to flow liquefaction - if (and only if) the static shear stress exceeds the residual strength of the soil. Cyclic mobility, another liquefaction-related phenomenon, can occur in dense as well as loose soils. | ||||
|
||||
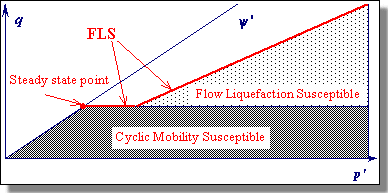
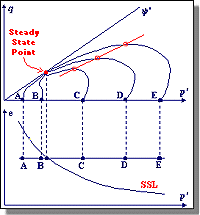
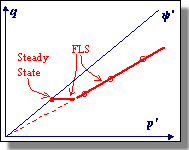
Flow Liquefaction On the left below is a plot of stress paths for five undrained shear tests. Three test specimens (C, D, and E) were subjected to loads greater than their residual strengths, and experienced flow liquefaction. A straight line (shown in red in the figure) drawn through the points where flow liquefaction was initiated projects back through the origin. This line is called the Flow Liquefaction Surface (FLS). Since flow liquefaction cannot take place if the static shear stress is lower than the steady state strength, the FLS is truncated by a horizontal line through the steady state point (see right figure below).The steady state strength is the strength a soil has when undergoing a steady state of deformation, i.e. continuous flow under constant shear stress and constant effective confining pressure at constant volume and constant velocity. Flow liquefaction will be initiated if the stress path crosses the FLS during undrained shear regardless of whether the loading is cyclic or monotonic loading ( Vaid and Chern, 1983). |
||||
|
||||
| The stress paths for monotonic and cyclic loading can be seen below. The flow liquefaction process can be described in two stages. First, the excess pore pressure that develops at low strains moves the effective stress path to the FLS, at which point the soil becomes unstable. When the soil reaches this point of instability under undrained conditions, its shear strength drops to the residual strength. As a result the static shear stresses drive the large strains that develop as the soil "collapses". A great amount of strain-softening takes place when the stress path moves toward the steady state point. | ||||
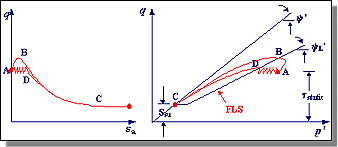 Flow Failure induced by cyclic and monotonic loading. |
||||
Cyclic Mobility |
||||
|
Cyclic mobility can occur even when the static shear stress
is lower than the steady state (or residual) shear strength. The geotechnical engineering
profession's understanding of cyclic mobility has advanced greatly within the past 10 years
or so. A key to this understanding came about with identification of the phase transformation line. Medium dense to dense sands subjected to monotonic loading will initially exhibit contractive behavior, but then exhibit dilative behavior as they strain toward the steady state. A plot of the stress path points at which the transformation from contractive to dilative behavior takes place reveals a phase transformation line (PTL) that appears to project back through the origin (Ishihara, 1985). |
||||
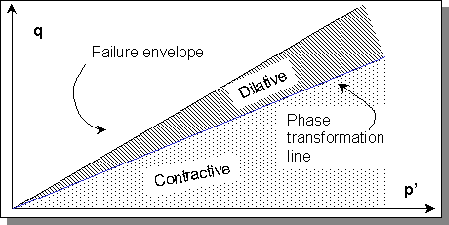 A p'-q plot of the phase transformation line |
||||
In the contractive region, an undrained stress path will tend to move to the left as the tendency for contraction causes pore pressure to increase and p' to decrease. As the stress path approaches the PTL, the tendency for contraction reduces and the stress path becomes more vertical. When the stress path reaches the PTL, there is no tendency for contraction or dilation, hence p' is constant and the stress path is vertical. After the stress path crosses the PTL, the tendency for dilation causes the pore pressure to decrease and p' to increase, and the stress path moves to the right. |
||||
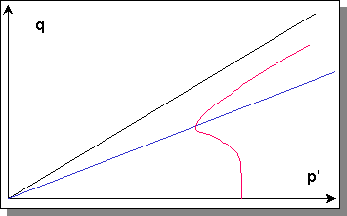 A stress path example. |
||||
|
Note that, because the stiffness of the soil depends on p', the stiffness decreases (while the stress path is below the PTL) but then increases (when the stress path moves above the PTL). This change in stiffness produces the "limited liquefaction" behavior originally noted by Castro. Under cyclic loading conditions, the behavior becomes even more complex. Remembering that the failure envelope and PTL exist for negative shear stresses as well as positive, it is easy to see that a cyclically loaded soil can undergo the contraction/dilation transformation in two different directions. The stress-strain and stress path plots for a harmonically loaded element of soil will therefore show softening behavior in the early stages of loading (before the stress path has reached the PTL) but then show cyclic softening and hardening as the stress path moves from one side of the PTL to the other. The result of the phase transformation behavior is reflected in the development of "banana-shaped" stress-strain loops. |
||||
 Cycmob3.gif |
||||
Evaluation of Liquefaction Potential |
||||
| Evaluation of the potential for liquefaction to occur is accomplished by comparing equivalent measures of earthquake loading and liquefaction resistance. The most common approach to characterization of earthquake loading is through the use of cyclic shear stresses. By normalizing the cyclic shear stress amplitude by the initial effective vertical stress, a cyclic stress ratio (CSR) can represent the level of loading induced at different depths in a soil profile by an earthquake. There are different procedures for evaluating the cyclic shear stresses - site response analyses may be performed or a "simplified" approach may be used to estimate CSR as a function of peak ground surface acceleration amplitude. | ||||
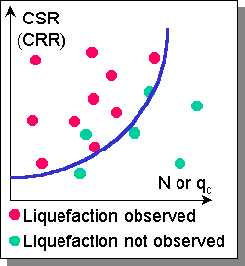 CSR versus N or qc |
||||
|
Liquefaction resistance is most commonly characterized on the basis of observed field
performance. Detailed investigation of actual earthquake case histories has allowed
determination of the combinations of insitu properties (usually SPT or CPT resistance)
and CSR for each case history. By plotting the CSR-(N1)60 (or CSR-qc) pairs for cases
in which liquefaction was and was not been observed, a curve that bounds the conditions at which liquefaction has historically been observed can be drawn. This curve, when interpreted as the maximum CSR for which liquefaction of a soil with a given penetration resistance can resist liquefaction, can be thought of as a curve of cyclic resistance ratio (CRR). Then, the potential for liquefaction can be evaluated by comparing the earthquake loading (CSR) with the liquefaction resistance (CRR) - this is usually expressed as a factor of safety against liquefaction, |
||||
FS = CRR / CSR | ||||
|
A factor of safety greater than one indicates that the liquefaction resistance exceeds the earthquake loading, and therefore that liquefaction would not be expected. |
||||
|
|
Home
|
What
|
When
|
Where
|
Why
|
How
| | Research | Links | |
