Roughly half of the coursework in Pre-MAP will be spent working on a research project in a very small group with mentors from the Astronomy Department, such as graduate students, postdoctoral fellows, or faculty advisors. The research projects typically advance the research goals of your mentor, and so the projects that we offer cover a variety of topics and size-scales from stars to galaxies.
Title: Identifying factors that affect star formation rates in a simulated galaxy
Mentors: Adrian Plenefisch and Prof. Tom Quinn
Students: Jessica Mattsen
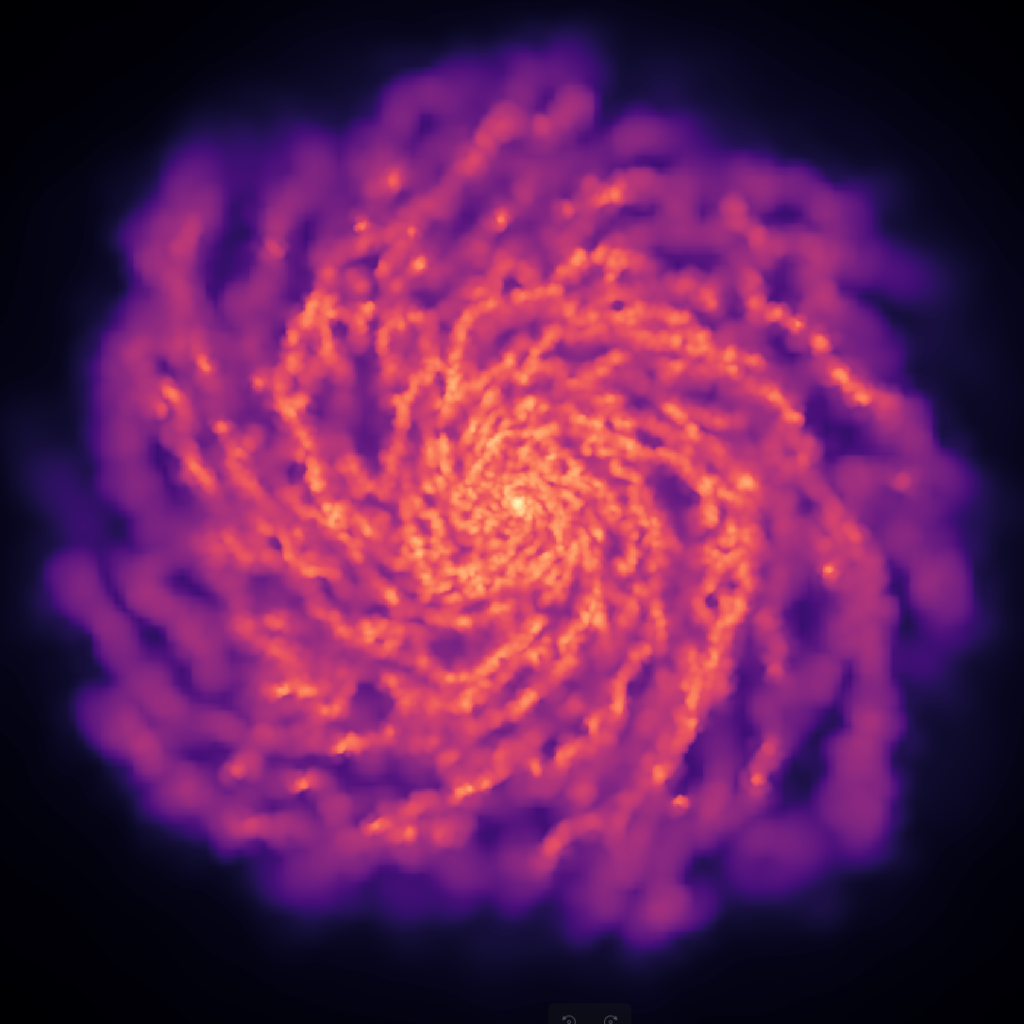
The physical processes that control the formation of stars occur over distances that are too small for a simulation of an entire galaxy to directly capture. Therefore, simplified models which rely primarily on local density and temperature are necessary when using simulations to learn about the star formation history of a galaxy. In this project, we will look at simulated galaxies which utilize a recently updated model of gas physics and the winds created by supernovae. We will determine what factors from the new model are most relevant to preventing or facilitating star formation, and whether those factors are physically reasonable.
Software: numpy, matplotlib, pynbody
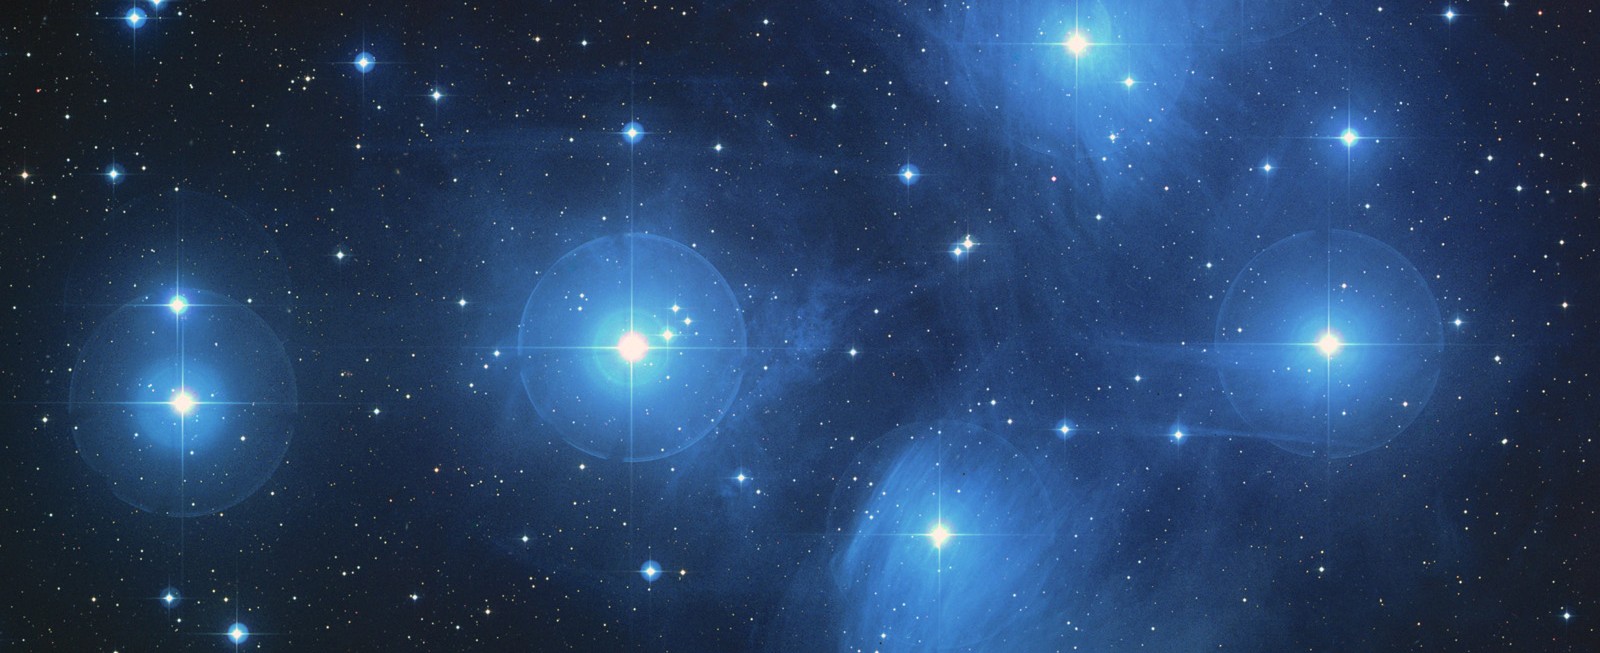
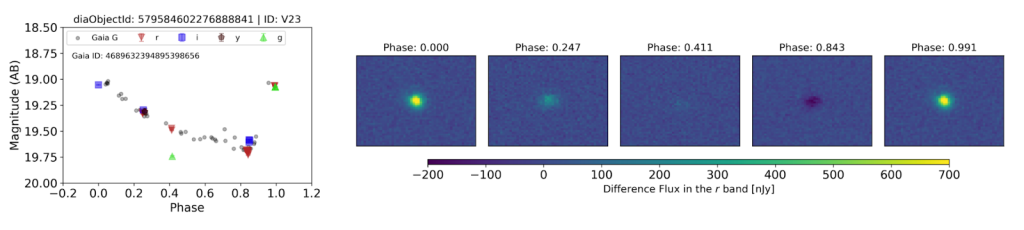
Title: Exploring the Mysterious Dipper Star TIC 161179929
Mentor: Andy Tzanidakis
Students: Maren Wilson and Daniel Zhang
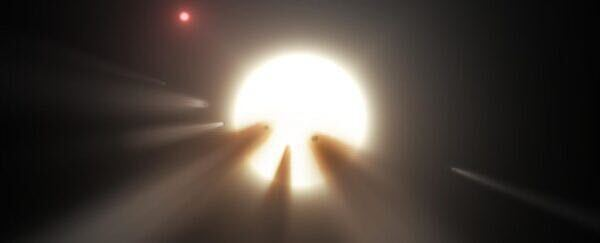
Main-sequence “dipper” stars are stars that briefly dim when dust or debris crosses our line of sight. The origins of such dusty material are still unknown, but a leading hypothesis is that it’s connected to planet formation and evolution. In this project, students will assist with investigating one of these mysterious stars, dubbed TIC 161179929. Students will help collect observational data from space- and ground-based observatories to better understand the properties of the dimming and the star.
Software: Pandas, astropy, numpy
Title: Can an Earth Twin be Habitable Around a Cool Star?
Mentor: Héctor Delgado Díaz
Students: Jessica Lemus and Avery Wolf

The astronomy community is preparing itself for the next NASA flagship mission: the Habitable Worlds Observatory (HWO). If the proposed budget cuts do not affect its budget, HWO will be launched in the 2040s and one of its purposes will be to find habitable Earth analogs exoplanets. The Star Catalog contains a proposed set of stars that may (or may not) have an Earth-like exoplanet orbiting around their habitable zone. For this research project we will use the called vplanet which simulates multiple properties of an exoplanet to study how habitable for life it could be. The goal is for you to choose a cool (low temperature) star from the Catalog and simulate an Earth around it to study how the surface temperature of the planet is affected by the star. We will aim to produce a plot that shows the temperature of the planet at different regions of the surface.
Software: vplanet, matplotlib, numpy, astropy
Title: Variable stars in early Rubin Observatory data
Mentor: David Wang
Students: Tamanpreet Kaur and Soren Logghe
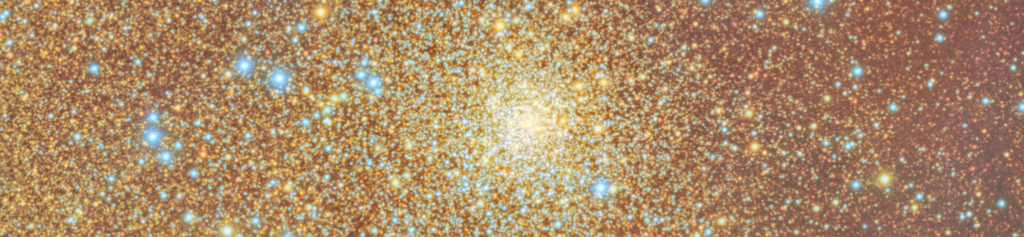
The Vera Rubin Observatory will take a 10 year survey, or “movie”, of the night sky, giving astronomers an opportunity to see the dynamic side of the universe at things changing in brightness over time. We are currently in the science validation phase, and many astronomers at UW are working on improving the data processing code in anticipation of the survey. In this project, you will take a look at some variable stars taken by Rubin Observatory in a dense stellar field, which is a challenging type of data to process. You will look at whether the period and amplitude of the variability of these stars matches those in the literature, and investigate whether any differences are due to data pipeline issues or interesting astronomical behavior!
Software: lsdb, astropy, lsst
Title: Fact or Fiction?
Mentor: Jake Kurlander
Students: Tina Dey and Emrys Marcelo Alfaro Haugen
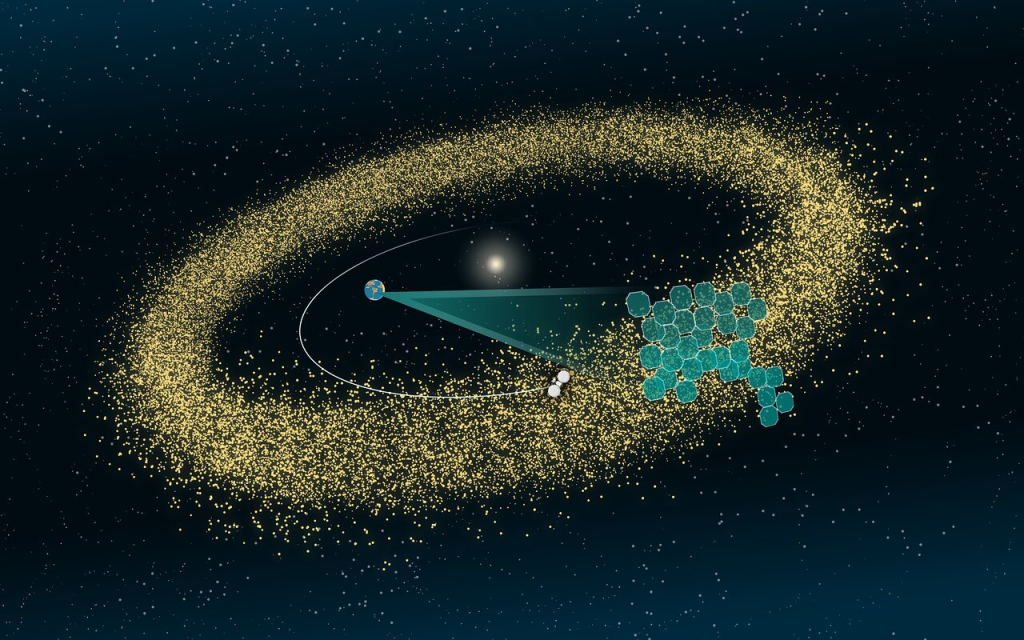
The Vera Rubin observatory, a new 8.4-meter survey telescope in Chile, is starting its mission to discover millions of asteroids over the next 3 years. We’ve already built many tools to solve the world’s biggest “connect-the-dots” problem, and we finally have real data: 13,000 images from “science verification” (SV) which contain hundreds of thousands of real asteroids. We use a combination of different features to score our candidate “linkages” (collection of moving dots). Help us improve our ability to separate real asteroid discoveries from spurious (false) linkages by testing different scoring systems (‘metrics’) and optimizing our weights using real SV data.
Software: Matplotlib, glob, pandas
Title: Estimating the Line Intensity Mapping Emission from Cosmological Galaxy Simulations
Mentor: Pip Peterson
Students: Tri Lam and Aidan Hawkins
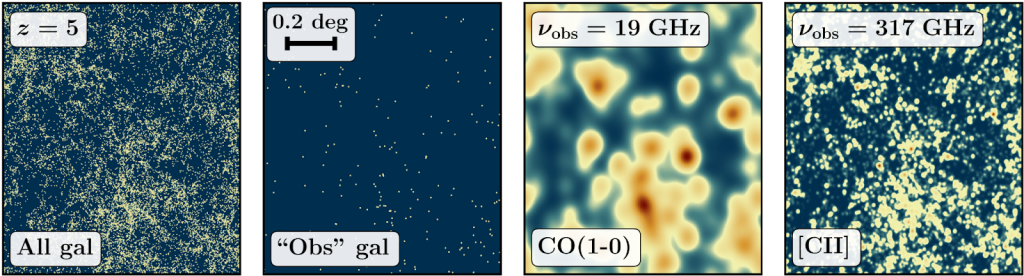
Traditional galaxy surveys are limiting because they can only observe the brightest objects in the sky, and so can only make good predictions of how galaxies trace the large scale structure of the universe at low redshift (close to the Milky Way). Line Intensity Mapping (LIM) is a developing astronomical observing technique to instead measure the large scale structure of the universe without having to resolve the exact positions of individual galaxies, by measuring the combined light from all the galaxies at once. In this project, you will be using the simulation suite IllustrisTNG to create simple mock intensity mapping images for different spectral lines (such as neutral hydrogen, carbon II, and carbon monoxide) to measure the distribution of galaxies in the universe. The goal is of this project is to introduce you to (1) what intensity mapping is and why it is useful in cosmology, (2) how to understand and use simple galaxy simulation outputs, and (3) how to combine LIM and galaxy simulations to make theory-based predictions for what current and future telescopes might observe.
Software: python, numpy
Title: Comparing Analysis Methods for Lyman alpha Forest Data: How Observational Errors Affect Different Statistical Approaches
Mentor: Hurum Maksora Tohfa
Students: Micah Kaczynski
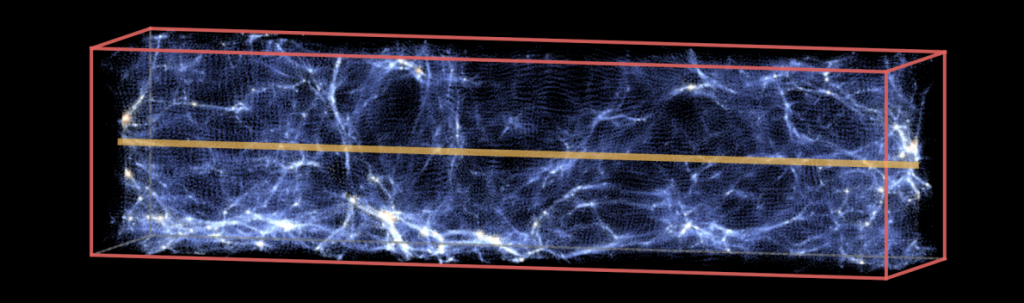
The Lyman-alpha forest appears as a series of dark absorption lines in the light from distant quasars, created when hydrogen gas between galaxies absorbs specific wavelengths of light. This cosmic “fingerprint” contains valuable information about the universe’s structure and evolution. Traditionally, astronomers analyze this data using power spectrum analysis, but recent research suggests that a newer method called wavelet scattering transforms can extract more information from the same data. This project will test both methods on realistic simulated data that includes observational errors (called “systematics”) to determine which approach is more robust when working with real telescope observations from the Dark Energy Spectroscopic Instrument (DESI).
Software: numpy, matplotlib, kymatio, FITS files
Title: Galaxy Emission Line Spectroscopy using SDSS
Mentor: Barbara Benda
Student: Ramya Sridharan and Marcus Neville
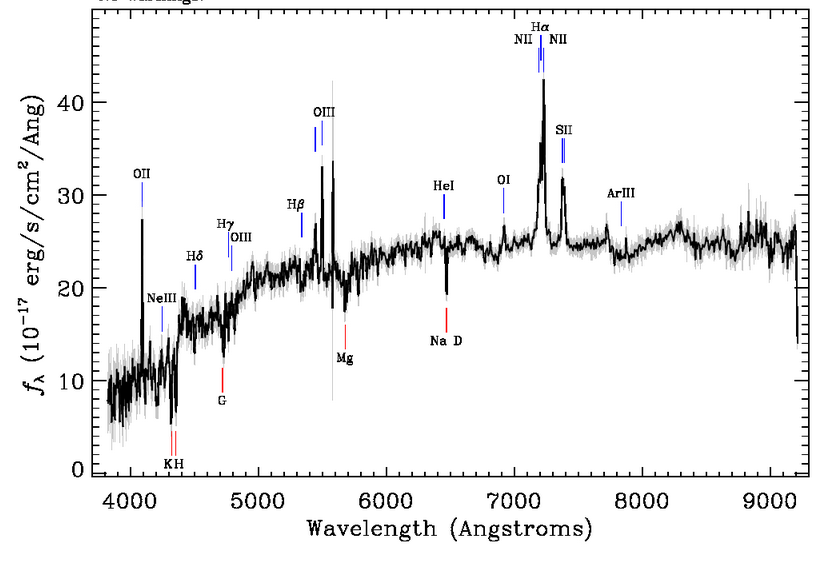
Emission lines from the interstellar gas in a galaxy offer valuable insights into its chemical makeup—such as metallicity, indicated by the ratio of oxygen to hydrogen—as well as its physical state, including temperature and density. These emission lines can also shed light on the physical processes that are shaping those conditions such as are the atoms being ionized by accretion from black holes or new stars forming. In this project we will use spectra from the Sloan Digital Sky Survey to identify different sources of ionization via the BPT diagram (named after Baldwin, Phillips, Tellric) and then investigate what factors influence a galaxy’s chemical enrichment by exploring the relationship between metallicity and various galaxy properties (such as stellar mass and star formation rate).
Software: matplotlib