Roughly half of the coursework in Pre-MAP will be spent working on a research project in a very small group with mentors from the Astronomy Department, a graduate student, postdoctoral fellow, or faculty advisor. The research projects typically advance the research goals of your mentor, and so the projects that we offer cover a variety of topics and size-scales from stars to galaxies.
Students can select their top three project choices, and we will sort you into groups among your top choices. Read about the projects below, and follow the links to learn about your potential advisors.
Title: Mapping Cosmic Baryon Cycle with Quasar Spectroscopy
Mentor: Jessica Werk
Students: Apurva Goel, Sophia Taylor
Skills: Python Notebooks (preferred; not required), basic unix commands, organization and pattern recognition skills
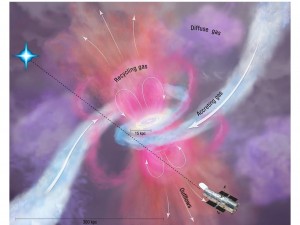 The atoms in your body and on this planet are continually cycling and recycling into a variety of forms and environments. The oxygen atoms in every breath we take were once breathed by ancient humans and dinosaurs alike. On an even grander scale, the atoms (aka baryons) in the Universe are cycling into and out of galaxies over billions of years. This so-called cosmic baryon cycle holds the key to understanding galaxy evolution and our own cosmic origins.
The majority of the atomic matter in the Universe lies in the diffuse, ionized, and warm-hot (T > 10^4 K) gas surrounding and in-between galaxies, aka the circumgalactic and intergalactic media. We cannot observe this gas directly by its own emission; instead we study it with a technique called Quasar Absorption Line Spectroscopy. In this method, the Quasars serve as bright background sources whose light passes through foreground intergalactic filaments and gaseous galaxy halos. The resulting absorption signatures seen in their spectra can be identified as ionized atomic transitions from Carbon, Nitrogen, Oxygen and other “heavy” elements at different redshifts that correspond to the distances of such gaseous features along the line of sight to the Quasar.
Professor Werk is conducting a large survey with the goal of understanding how this diffuse gas correlates with galaxy properties. A key part of the study requires carefully classifying all of the absorption features seen along high-resolution Quasar spectra taken with the Cosmic Origins Spectrograph (COS) on the Hubble Space Telescope (HST). We will analyze these spectra using Python tools in a graphical user interface which will enable us to identify the redshifts and measure the strengths of absorption lines from ionized elements present in the gas. By mapping the redshift distribution of many so-called `absorption line systems’, we will ultimately constrain the very elusive cosmic baryon cycle that gave rise to the visible structures in the universe.
Title: Observing the Air Quality at Manastash Ridge Observatory
Mentors: Oliver Fraser
Students: Ling Tsiang
Skills: UNIX/Linux, Python, Arduino (like C)
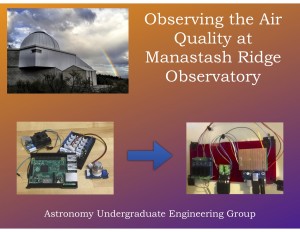
Wildfire smoke is more than a troubling new phenomenon in late summer, it’s also a pollutant that degrades telescope optics. We’d like to develop a smoke sensor to help us understand what’s in the air at the observatory, and how quickly it can change, with the eventual goal of using this information to protect the telescope’s mirrors. This project will involve building an Internet of Things (IoT) device out of sensors, an Arduino, a Raspberry Pi, and some code. There will be opportunities during and after Pre-MAP to travel to the observatory in Central Washington; we also expect to you will present a poster on the project at the Mary Gates Undergrad Research Symposium in May.
Title: Hunting for Burping Binaries
Title: Building Rocky Planets Close To Their Host Stars
Mentors: Spencer Wallace
Students: Sarah Kahle, Lynn Nguyen
Skills: Python, iPython/Jupyter notebooks, matplotlib
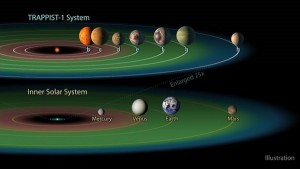
The theory of how planets form involves small, rocky bodies called planetesimals colliding together and merging to form progressively larger objects. The result of this process is a collection of Moon to Mars sized bodies called planetary embryos which will eventually coalesce to create rocky, Earth sized planets.
Recent results from Kepler have revealed planetary systems that look very different from our own. TRAPPIST-1, which consists of seven Earth sized planets all with orbital periods less than 20 days, is a perfect example. These systems with tightly packed inner planets (STIPs) contain a handful of rocky Earth-sized planets all extremely close to the star. A major question that astronomers have is whether these planets formed at their present location (in situ), or whether they were born further out where planet forming material is more plentiful and then migrated inwards. The fact that these planets have a predominantly rocky composition points toward in situ formation. This is causing astronomers to rethink how the planet building material might be distributed near the star.
This project will involve analyzing supercomputer simulations of colliding planetesimals. We will explore the collisional outcomes for various planetesimal distributions close to the central star. The goal of this will be to better understand how much material is necessary to form the STIPs at their present locations.
Title: Hunting for Jellyfish (Galaxies)
Mentors: Iryna Butsky
Students: Jasmine Smith, Daniel Piacitelli
Skills: Python, numpy, pylab, basic UNIX
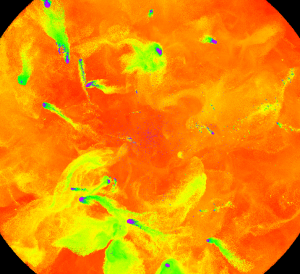
Galaxy clusters are the largest structures in our universe and are integral to testing cosmological theories which help us understand how the universe formed and ultimately predict its fate. The hot plasma that fills the space between galaxies in a galaxy cluster (the intracluster medium; ICM) is a unique environment, that governs how galaxies live and die. Galaxies that move quickly through the ICM experience an effective wind that strips away their gas (an effect known as ram pressure stripping). In extreme cases of ram pressure stripping, the deformed galaxies are dubbed “jellyfish galaxies”, characterized by their long tails of metal-enriched gas
In this project, you will be exploring data from the highest-resolution simulation of a galaxy cluster to-date, run on one of the largest supercomputers in the country. You will use python-based data visualization tools to explore these galaxies and discover the correlations between the structure of the stripped tails, the observed metal abundances in the ICM, and the mechanisms driving ram pressure stripping.
Title: Estimating Photometric Redshifts with Symbolic Regression
Mentors: Brianna Thomas
Students: Madison Durand
Skills: Unix, Python, Data Visualization, SQL (All introductory)
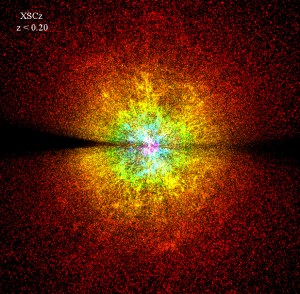
Similar to the change in sound that we hear as a source of sound moves closer and farther away from us, the light from objects in space also exhibit the same behavior when we detect them; they shift bluer when the objects move toward us and redder when they move away from us. Redshift has been critical to current astronomy research because not only did the famous Edwin Hubble find a constant relationship between the recessional velocities of galaxies and their distances (the Hubble Constant), but other astronomers (Perlmutter, Schimdt, and Reiss) have also found that the velocities of galaxies increase with distance. This concluded that the expansion of the universe is accelerating! We can use the redshifts of galaxies to study this phenomenon even more, which so far has been attributed to dark energy.
There are two types of observations we use to measure redshift: photometric (data in a specific wavelength) and spectroscopic (data in a wide range of wavelengths). While spectroscopic data can give you the most accurate redshift measurement, there is a lot less available of it than photometric data. Can we estimate correct, spectroscopic redshifts from photometric data? Thanks to a group of astronomers (Krone-Martins et. al, 2014; https://arxiv.org/pdf/1308.4145.pdf), it turns out that we may be able to with a data science method called symbolic regression. Symbolic regression is a machine learning technique that aims to identify a mathematical expression that best describes a relationship in your data. It is very difficult to code this on your own, but luckily there are already two user-friendly Python packages available that do most of the hard work for you. The first group used a very expensive symbolic regression program called “Eureqa” to obtain their results; can we get better results than the first group using the free, open-sourced packages? My team and I under Matthew Graham in the La Serena School for Data Science were able to produce a pretty good result–let’s see if you can too!
