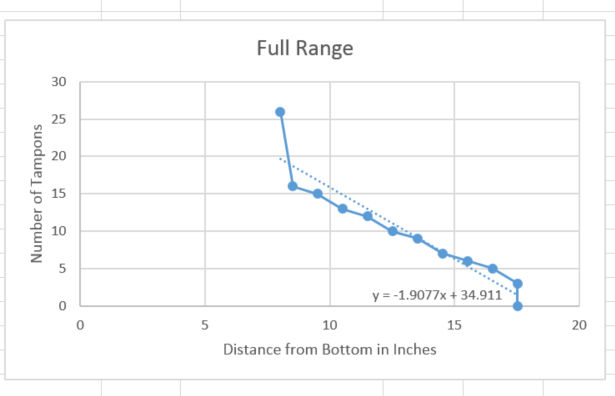
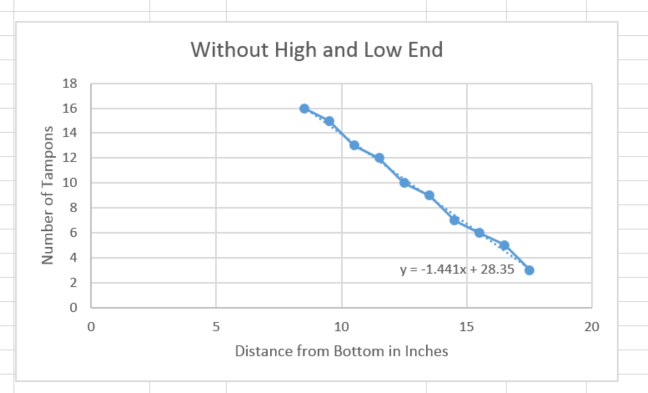
 This week I worked with the current sonic sensor to test how accurate it would be in use. The graphs above are my observations about reported distance and the number of tampons in the dispenser. I was trying to generate a function that would calculate the number without a lookup table. The first graph, it did not work out well because I included the ends, where the biggest outliers are. Removing those outliers, it gets much better. Unfortunately, this means it will be hard to tell how much product is left when the dispenser is close to empty. This sensor is unable to tell the difference between empty and 3 tampons left. I also discovered an issue where the current sensor needs about a minute of calibration time with an empty dispenser, which will be hard in the field. To this end, I began researching similar sensors and will be trying a new one in the near future.