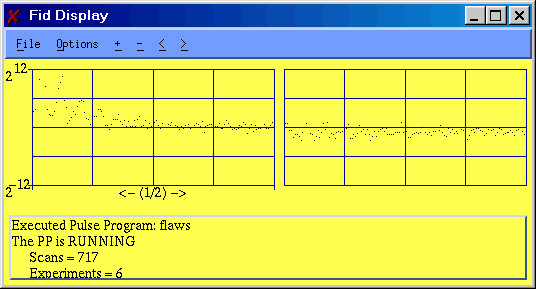
The FID Display program window looks like this:

Each of the items in the window is explained in the sections that follow. These sections can be reached directly by clicking on the items in the above picture.
The FID Display program provides a real time display of the data being collected by the spectrometer. The program is usually started from the Manager but can also be started directly from the command line by typing the command fid_display. The window is resizable and can thus be changed in size to suit the user by dragging the lower right corner.
The window displays the data that is currently in the data memory of the digital acquisition processor (the DAP). The update of the display is under the direct control of the pulse program. At each point in the pulse program where the author thought it appropriate to update the display, the pulse programmer sends a message to the DAP requesting that the display be updated. Typical pulse programs due so at the beginning of each relaxation delay.
The menu bar provides access to options that control what data is displayed (the real or imaginary parts, or both), the scaling of the display, the colors used, etc. Options can also be specified as command line parameters when the program is started. The default parameters used when the Manager program starts the FID Display can be specified in the console configuration file.

The File menu contains only one item: exit. Selecting this item terminates execution of the program.
The options menu contains the following items, each of which is described below:

The Real, Rmaginary, and Both items select which part of the data is displayed. If Both is selected, the two parts of the data are displayed side by side, with the real data on the left. The three items are mutually exclusive, with the currently selected item indicated by the small checkbox to the left of the item.
The Grid item toggles on or off the grid in the data display area.
The Status item toggles on or off the status display box at the bottom of the display
The Autoscale item toggles on or off automatic scaling of the data. When this features is on, each time the display is updated the scale is adjusted so that the maximum and minimum values in the data fit on the screen without clipping.
The Colors item brings up a dialog that allows the user to select the color of each element of the display.
![]()
These two items are buttons that can be clicked to change the display scale. Clicking the "+" item increases the apparent height of the display by actually decreasing the range of the scale. Clicking the "-" item does the opposite, it decreases the apparent height of the display by actually increasing the range of the scale. In either case the scale is always changed by a factor of two. The scale factor is always shown on the left side of the Data Display Area.
In order to use these controls, the user should first turn of Autoscale in the Options menu. Otherwise, the display scale will be recalculated each time the display is updated and the effect of the controls will be canceled.
![]()
These two items are buttons that control what fraction of the data is displayed. Typically, all the data points are displayed, which is to say that the fraction of the points displayed is 1/1. Clicking the ">" button doubles the denominator of the fraction. For example, clicking the button once will change the fraction to 1/2. In this case only the first half of the collected would be displayed. Clicking the button again would reduce the fraction to 1/4. The "<" button has the opposite effect.
The current display fraction is always shown at the bottom of the Data Display Area.

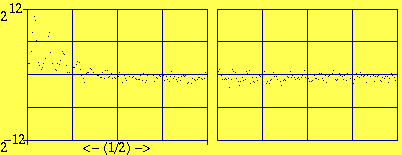
This picture shows the elements of the data display area. In this case, both the real and imaginary parts of the data are displayed, with the real data on the left, and the display grid is turned on. The choices of data and the grid are both selectable from the Options menu.
The display scale is shown on the left at the top and bottom. In this case, the display scale range is from 212 to -(212) counts. Display scale is controlled by the Autoscale item in the Options menu and by the "+" and "-" Scaling Controls on the menu bar.
The display fraction is shown at the bottom. In this case, only the first 1/2 of the available data points are displayed. The display fraction is controlled by the "<" and ">" Display Fraction Controls on the menu bar.

This area displays the current status of the pulse programmer: halted, running, paused, etc. It also displays the name of the current pulse program and any other information that the pulse program makes available, such as the scan number.
All of the options that can be controlled from the Options Menu can also be set from the command line when the program is started. When the FID Display is launched from the Manager, it is started with the command line options specified in the console configuration file. For example, the following line in the file requests that the Manger start the FID Display such that both the real and imaginary data are displayed, the grid lines are enabled, and the status display box is enabled.
FID_OPTIONS -both -grid -status
The program accepts the following command line option specifiers:
This option turns on the FID display grid lines. By default, the grid lines are off.
This option enables the Status Display Area at the bottom of the display. By, default, the Status Display Area does not appear.
These options control what part of the FID data is displayed: the real part, the imaginary part, or both. These options are mutually exclusive; if more than one occurs on the command line, the last occurrence takes precedence. Real data only is the default
Background display color. See Display Colors for a list of the possible values for color. The default is gray.
FID data points display color. See Display Colors for a list of the possible values for color. The default is black.
FID grid lines display color. See Display Colors for a list of the possible values for color. The default is white.
Text display color. See Display Colors for a list of the possible values for color. The default is white.
The color argument on the command lines options that specify display color can have any of the following text values:
Black
Blue
Green
Cyan
Red
Magenta
Brown
Gray
Dark Gray
Light Blue
Light Green
Light Cyan
Light Red
Light Magenta
Yellow
White