by James Gregory
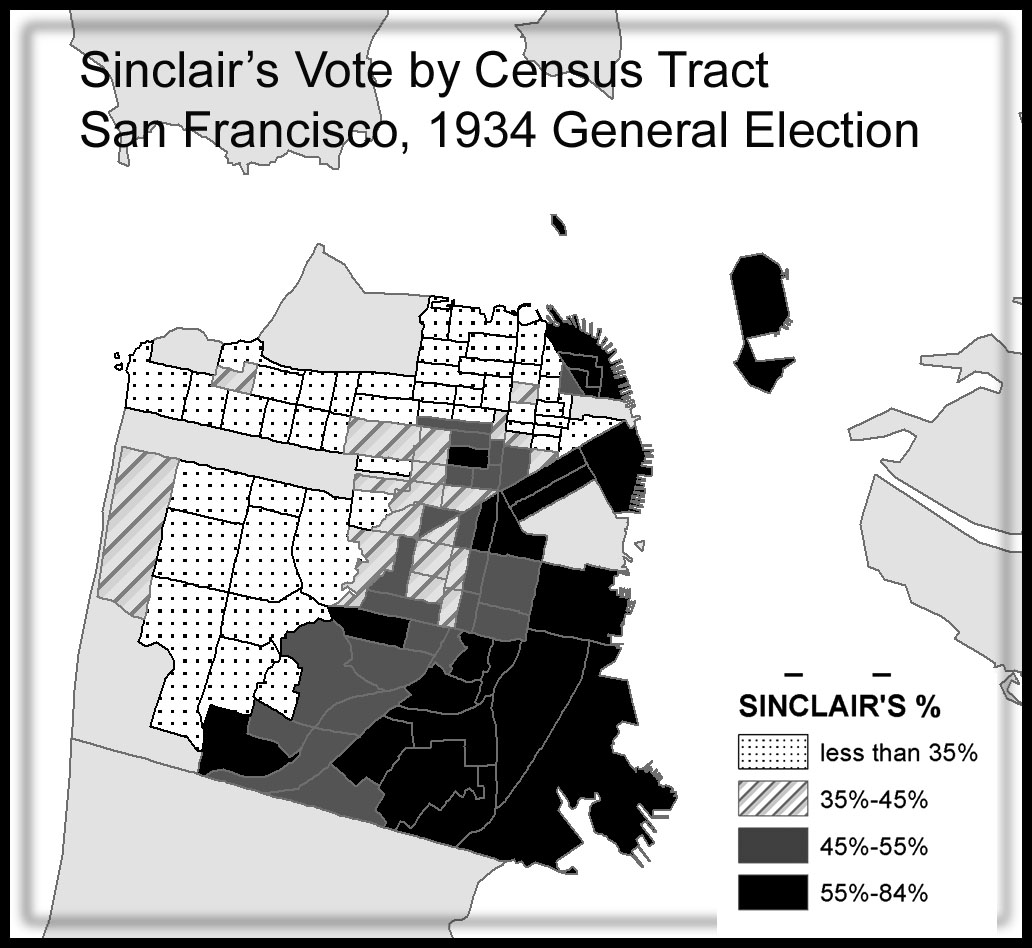
San Francisco County: Sinclair's percentage of the vote by census tract. Map by author.
This essay is derived from “Upton Sinclair’s 1934 EPIC Campaign: Anatomy of a Political Movement,” by James N. Gregory, published in LABOR: Studies in Working-Class History (December, 2015), 51-81. That article is the first careful analysis of the inner workings of Upton Sinclair’s pivotal campaign using detailed election and census data.
879,537 Californians voted for Upton Sinclair and the EPIC program in the November 1934 gubernatorial election. Not enough to win, he came in well behind incumbent Frank Merriam's 1,138,620. Still, this was an impressive showing for a former Socialist proposing a radical program to end poverty and replace capitalism with "production for use" cooperative enterprises. Sinclair had received almost as many votes in a single state as Socialist Party presidential candidate Norman Thomas had won nationwide in the 1932 election.
Who were these Sinclair supporters? This question has puzzled historians for generations, most of whom have followed the lead of Carey McWilliams who assigned the movement to the "disoriented middle class." My research shows otherwise. Let's begin with a geographic analysis of the vote then examine its class, gender, and ethnic dimensions.
EPIC was wildly popular in some communities, equally unpopular in others. The maps and tables below show the percentage of vote for Sinclair in 123 incorporated municipalities. Zoom and scroll for details. Red means Sinclair beat Merriam and Haight while securing at least 50% of the total vote. Orange indicates he led other candidates with at least 45%. All of these pro-Sinclair totals came from working-class communities in Los Angeles County or the San Francisco Bay Area. The industrial suburbs of Hawthorne and South Gate in the Southland gave him more than 60% of their votes, as did the steel town of South San Francisco. Dark blue signifies that Sinclair was so unpopular that he gained less than 25 percent of the votes cast. Some of these places were enclaves of wealth like Beverly Hills in southern California and Hillsborough in the Bay Area, but most were farming towns like Woodland, Visalia, and Tulare where agribusiness leaders worried about Sinclair’s land colony schemes and about the wave of farm worker strikes that had disrupted key harvests the previous year.

Sinclair did not do well outside the two major metropolitan areas: Los Angeles County and the San Francisco-Oakland Bay Area. He secured small pockets of support in some of the mountain counties where miners and timber workers struggled with high rates of unemployment and in railroad towns like Colton, Roseville, and Needles, but otherwise there was a sharp metropolitan versus non-metropolitan division in the 1934 election results. Sinclair built much of his support in Los Angeles County. That single very populous county gave him 405,331 votes in the November election, 46 percent of his statewide total. He did not win in Los Angeles, but with 42 percent of the county’s vote he did better there than in any other major county. San Francisco and Alameda counties (Oakland) gave Sinclair his next largest totals (87,850 and 73,233 votes) and also supported him at higher rates than the state average. In other regions the movement gained little traction. Rural and small city California heard little that was positive and much that was negative about Sinclair and his plans. Moreover, in California’s Central Valley, Raymond Haight’s candidacy proved a major obstacle. Backed by the McClatchy newspapers, the Sacramento Bee, Fresno Bee, and Modesto Bee, Haight won some valley counties and nearly matched Sinclair’s total for the Central Valley as a whole.
San Francisco County: Sinclair's percentage of the vote by census tract. Map by author.
I have been able to explore some of the demographic characteristics of Sinclair’s supporters using ecological inference techniques.
The demographic information comes from aggregated census data for geographic areas. When variations in the population characteristics
of these areas are statistically associated with variations in the vote, we obtain an indication of how particular segments of the
population voted. This analysis is most reliable for the three metropolitan counties where the Census Bureau reported data by census
tracts in 1940. What follows is based on a dataset that combines vote numbers from more than 5,000 precincts with census information
for 700 census tracts in Los Angeles, San Francisco, and Alameda counties. Please see the Anatomy article for an explanation of methods
and potential errors.
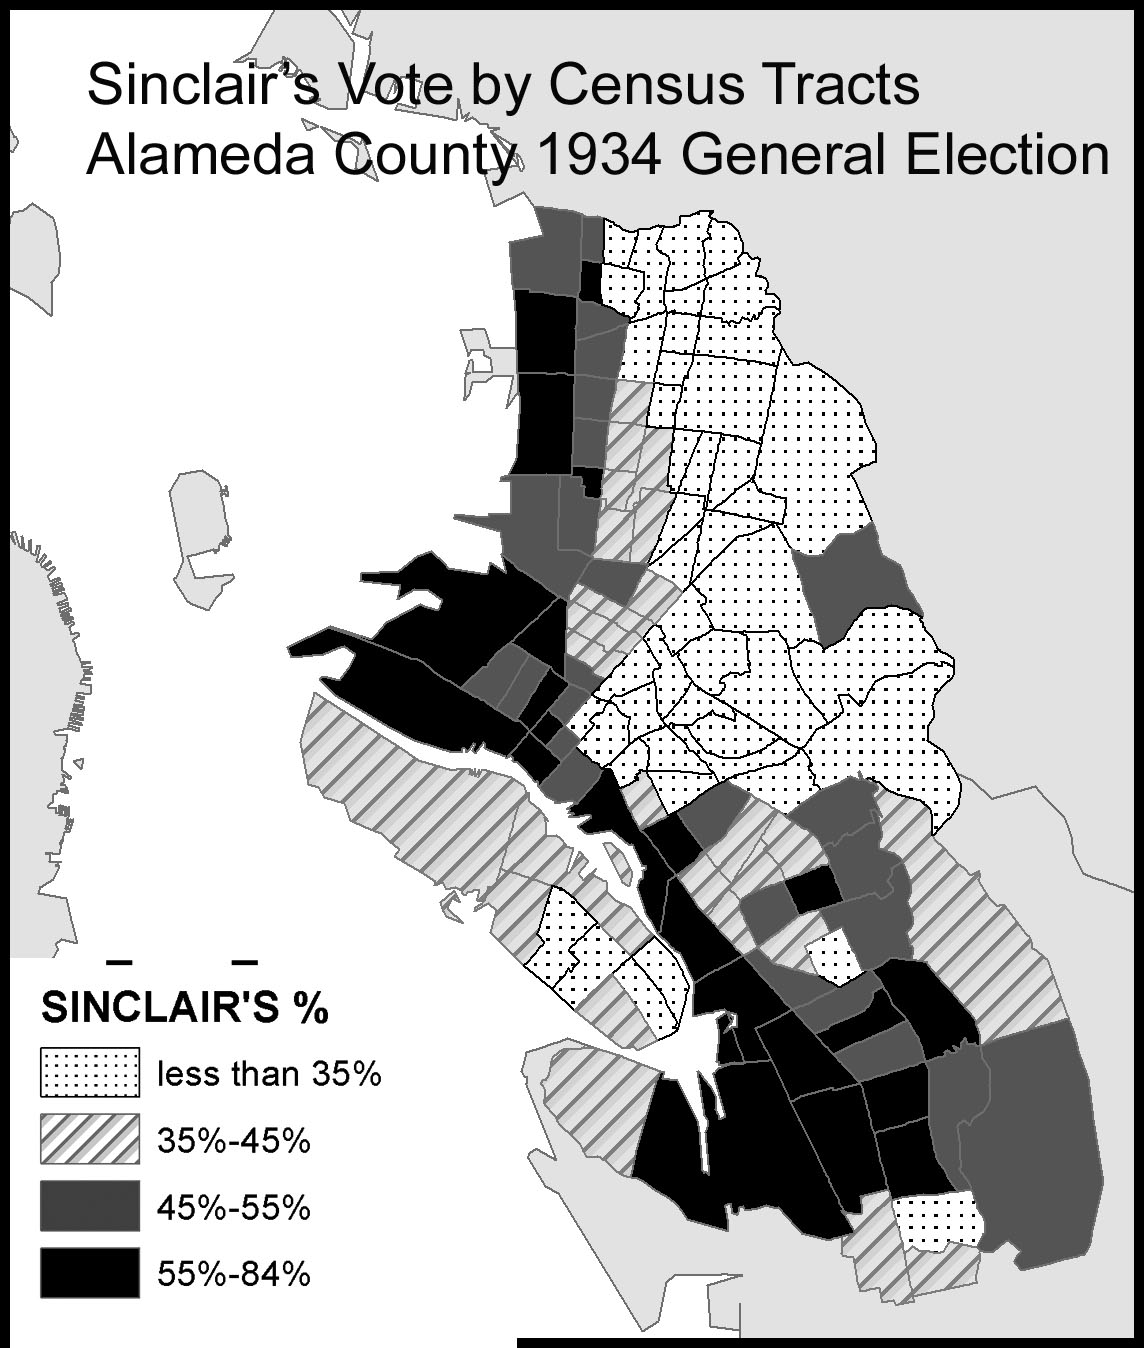
Alameda County: Sinclair's percentage of the vote by census tract. Map by author.
Maps of the three counties show the distribution of votes by census tract. The black areas are tracts where Sinclair received 55% or more
of votes cast in the November general election. Dark gray means he won the tract with at least 45% of the vote. The lighter areas were won
by Frank Merriam. In light crosshatch areas Sinclair’s total was between 35% and 45%, and in white dotted areas he received less than 35%
of the votes cast.
In all three maps, there are strong indications that the vote broke along class lines. Sinclair won census tracts where males held mostly blue collar jobs, where housing costs were low, and adults on average had spent nine years in school. A sharp diagonal split San Francisco in the 1930s with blue-collar families mostly living south of Market Street, in the Mission, outer Mission, and Visitacion Valley districts. Sinclair carried this entire area while doing poorly in the other half of the city. The blank areas on the map were military installations, parks, and a couple of neighborhoods for which data are lacking.
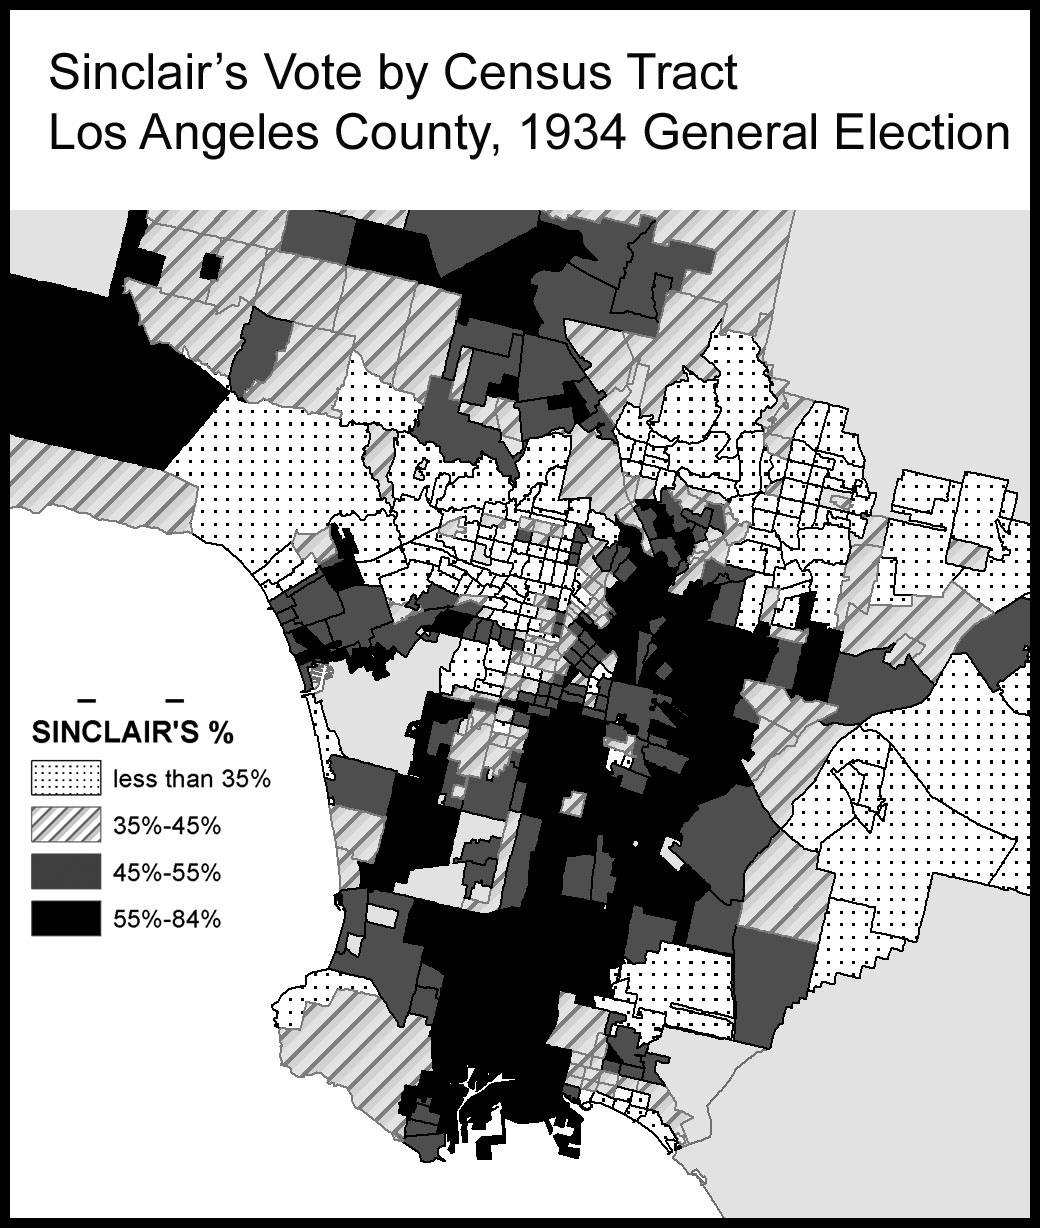
Los Angeles County: Sinclair's percentage of the vote by census tract. Map by author.
In Alameda County, Sinclair won the districts near the bay in Albany, Berkeley, and west and south Oakland. All of these areas were predominantly
white working class neighborhoods in the 1930s.
The class pattern is also apparent in the map of Los Angeles County. The black and gray areas near the center of the map are Boyle Heights and East LA which were inhabited by eastern European Jews, Italians, and Mexicans and there is a clump of support above that in North Hollywood and Burbank. But the largest concentration of Sinclair supporters is in the line of industrial suburbs that stretched south of the city limits. South Gate, Torrance, Hawthorne, Huntington Park, Bell, Maywood, Compton, Signal Hill, north Long Beach--these were working-class communities sited near oil refineries, tire and automobile assembly plants, aircraft, furniture and other industrial concerns.
Using regression analysis we can tease out further information about voting demography, weighing the significance of occupation, race, national origins, age, and gender. Here I will report only the conclusions. Consult the Anatomy article for the details.
- First, there is a very strong association with the percentage of blue-collar males in the voting age population, indicating that Sinclair captured a heavy majority of working-class male votes in each county and not very many white-collar votes.
- Second, the regressions reveal a modest gender gap, indicating that women were on average less supportive than men. Class would have still been the most powerful predictor of vote among women, so that the majority of women in working class households probably voted for Sinclair but at a lower rate than their male counterparts.
- Age mattered little. One of the longstanding assumptions about EPIC is that it was related in spirit and constituency to the other unorthodox political movements that emerged in Southern California during the early 1930s including Dr. Francis Townsend's Old-Age Pension movement. But these data suggest that older voters of each class were no more likely than younger voters of the same class to support Sinclair.
- I expected to see opposition to Sinclair in the Black communities, the most important of which was along Central Avenue in Los Angeles. Sinclair paid only slight attention to African Americans during the campaign, most of whom had long been loyal to the Republican party, the party of Lincoln. But Sinclair seems to have done better than expected. The Los Angeles equation shows a small lean away from Sinclair when other variables are controlled. Given the class composition of the community, Sinclair may have corralled close to half of African American votes.
- Estimating the voting patterns of other ethnic populations is complicated by incomplete data. Very cautiously, we can say there is some likelihood that Jewish voters leaned toward Sinclair while Italian Americans and Mexican Americans voted more or less along class lines.
The sharp class patterns in Los Angeles County and the Bay Area disappear in other areas of the state. Not only did support for Sinclair drop precipitously outside the major metropolitan areas, he also seems to have lost his key demographic association with blue-collar voters. These findings remind us of the importance of context and the fact that successful political campaigns depend upon elaborate infrastructures of persuasion and mobilization. In the non-metropolitan areas, EPIC faced a number of obstacles. Distance and logistics for one thing. Sinclair lived in Pasadena and refused to spend much time campaigning outside of the LA area. He made five trips north, giving most of his speeches in the Bay Area, depending upon supporters to campaign in the smaller cities. EPIC clubs formed in nearly all of the nonmetropolitan counties but it was harder for them to get EPIC News bundles and other campaign materials in a timely manner and harder to generate the mass enthusiasm that the campaign recorded in the Southland and Bay Area. This had something to do with the position of radicals and progressive Republicans in these areas. Socialists, Communists, and other radicals living in rural counties were more isolated and more persecuted than their counterparts in the big cities, especially after the 1933 wave of Communist-led farm strikes had ended in a massive crackdown and criminal syndicalist prosecutions.
If the left was preoccupied, so were progressive Republicans, who, particularly in the Central Valley, rallied behind Raymond Haight, running under the Progressive Party banner. Haight’s strength in this region was due to the endorsement he received from the Central Valley’s most powerful newspaper chain, the McClatchy owned Sacramento Bee, Fresno Bee, and Modesto Bee. The Bees had long been a key part of the coalition that had stood behind Hiram Johnson and progressive Republicans for more than twenty years. In 1934, unable to stomach the conservatism of Frank Merriam or the radicalism of Upton Sinclair, the McClatchy family endorsed and campaigned vigorously for Haight. The newspapers’ influence is easily seen in the vote. In each of the six counties within a 50-mile circulation range of one of the three Bees, the third party candidate outpolled Sinclair and in two of them he also beat Merriam.