|
|
Race and Segregation in Washington Cities and Counties 1940-2020
These maps explore the dimensions of race and segregation history for Seattle, Tacoma, Everett, Spokane, Vancouver, and the Tri-Cities as well as each county in Washington State from 1940 to the present.
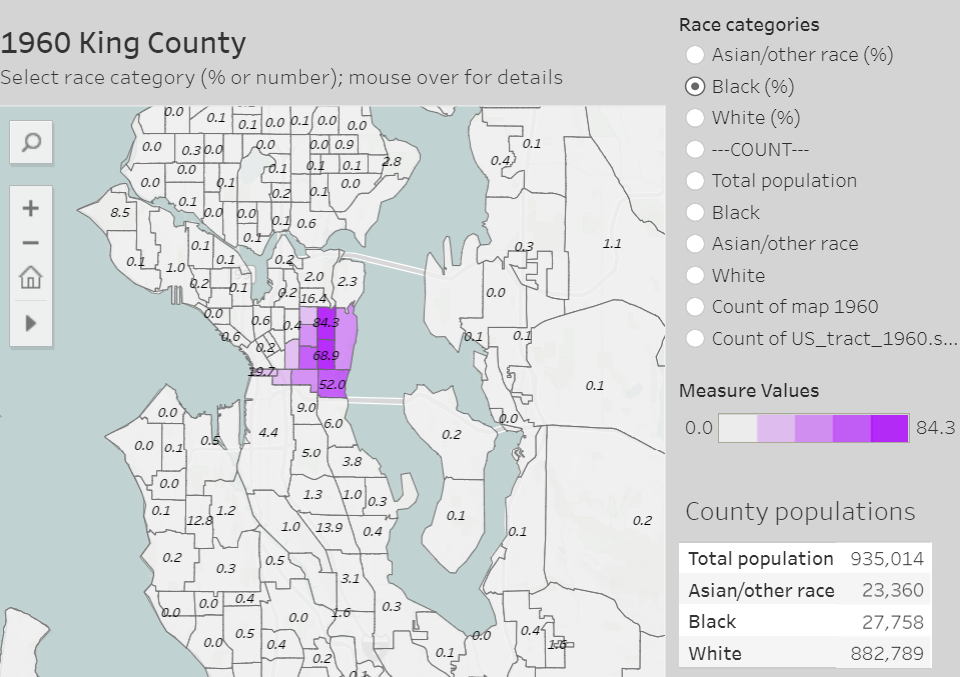
Seattle/King County |
Here we map patterns of racial segregation for African Americans, Asians Americans, Native Americans, Latinos, and Whites using census tract data. Explore 70 years of population growth and residential change in this sequence of interactive maps. Select a race category. Click a census tract for detailed information about a neighborhood. Some things to notice: The Central Area served as a ghetto for all peoples of color until the late 1970s. Since then, nonwhite groups have spread in different patterns. And read "Seattle's Race and Segregation Story in Maps 1920-2020," a brief history of the decade by decade changes. |
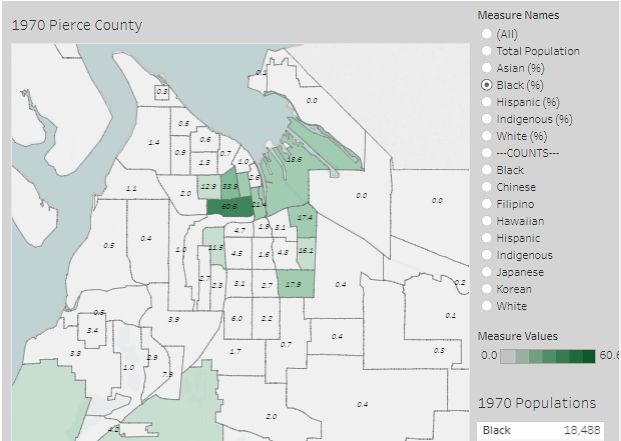
Tacoma/Pierce County |
In 1970, nearly one-third of Pierce county's Black population were military personel at Fort Lewis. Most of the rest rest lived in Hilltop neighborhood near the bend in the I-5 freeway. Asian and Latino people numbered only 5,373 in 1970, a quarter of them stationed at the military base. Tacoma began to diversify and desegregate in the decades that followed. But as shown on these maps, it has been a slow process. Move through the decades. Select a race category, either by percentage or number of residents.
|
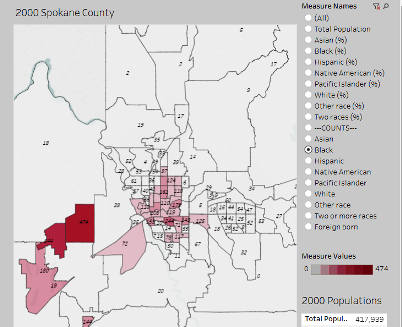
Spokane City/County |
In 1970, the population of Spokane County was 98% White. Less than 3,000 African Americans, 2,000 Indigenous Americans, and 1,800 Asian Americans endured intense discrimination that limited employment and housing opportunities. A small area in East Central Spokane that had recently been bisected by the I-90 freeway was the primary neighborhood for families of color; except for those stationed at Fairchild Air Base. A vigorous civil rights movement helped Spokane diversify and desegregate since the 1970s. But as shown on these maps, it has been a slow process. Move through the decades. Select a race category, either by number of residents or percentage. Click a census tract for detailed information.
|
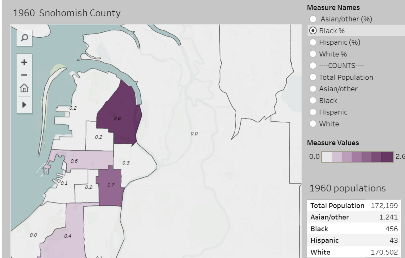
Everett/Snohomish County |
In 1970, Snohomish County counted only 1,012 Black residents, 43 of them inmates in Monroe Prison. Asians numbered only 937. The tiny numbers speak to something other than racial segregation. Exclusion was the issue. The county had a reputation for hostility towards Black and Asian people. Snohomish began to diversify in the decades that followed. But as shown on these maps, it has been a slow process. Move through the decades. Select a race category, either by percentage or number of residents. Observe the changing residential patterns.
|
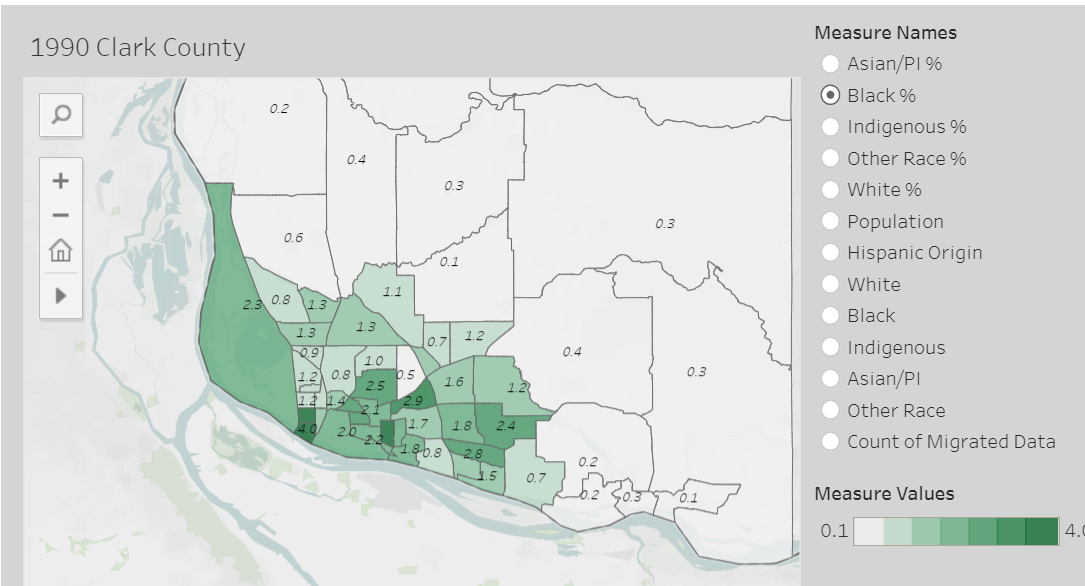
Vancouver/Clark County |
In 1970, 99% of the residents of Clark County identified as White. 548 Black folks, 398 Indigenous Americans, 371 with Asian/PI ancestries, and 151 with Hispanic backgrounds resided in the county, many in an impoverished Vancouver neighborhood near the I-5 bridge across the Columbia. These people were survivors, the remnants of what had been a much larger nonwhite population. In 1945, a wartime census had estimated that 8,825 African Americans lived in Vancouver. In the years that followed, they were pushed out, denied jobs and housing, forced to leave. The city and county have slowly diversified since the 1980s, but even in 2019 the Black population of the entire county is smaller than the 1945 numbers for Vancouver alone. Watch the slow process of re-diversification on these maps. Move through the decades. Select a race category, either by percentage or number of residents.
|
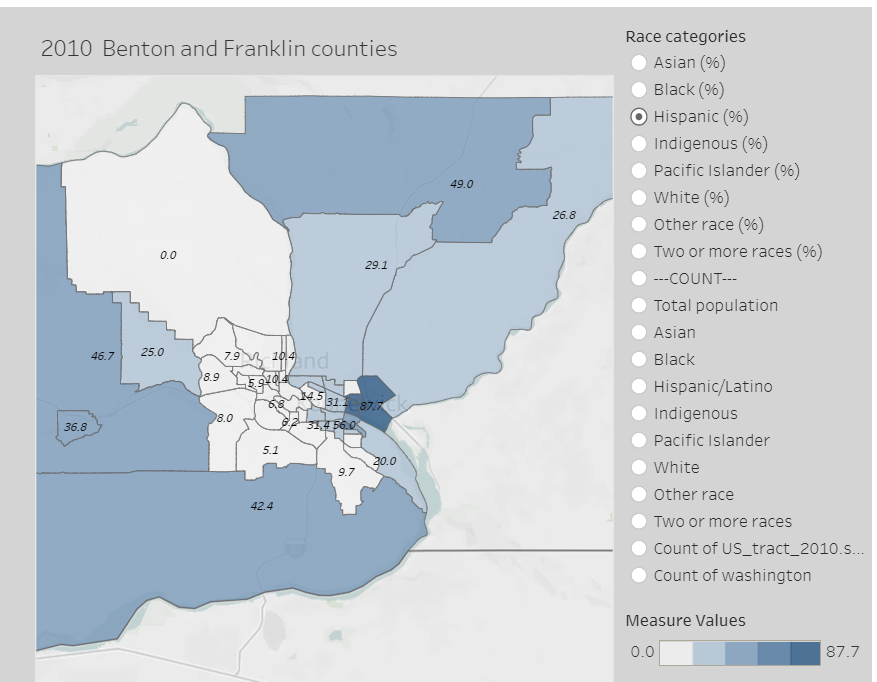
Tri-Cities/Benton and Franklin Counties |
There is nothing subtle about the Tri-Cities' reputation for racism and segregation. For decades Kennewick and Richland were sundown towns, banning Black people after dark. African Americans were forced to live in East Pasco and even after discrimination became illegal segregation continued. As shown on these maps, it was not until the census of 2000 that residential patterns opened for African Americans. Pasco also became home to the rapidly expanding population of Latinos. It is only in the current century that Kennewick and Richland have begun to diversify.
|
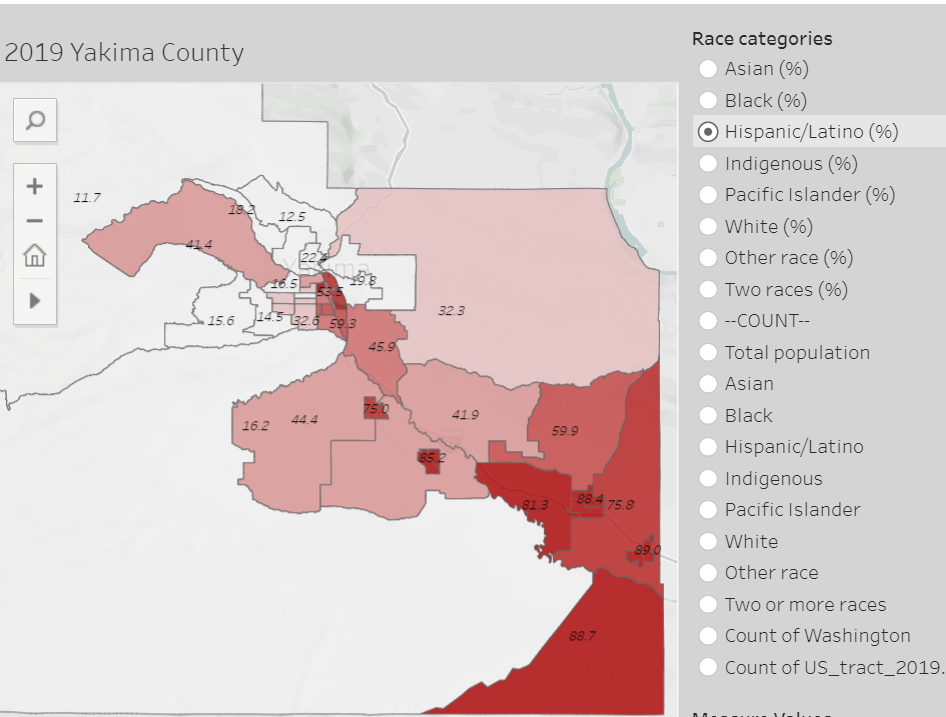
Yakima City/County |
needs content
|
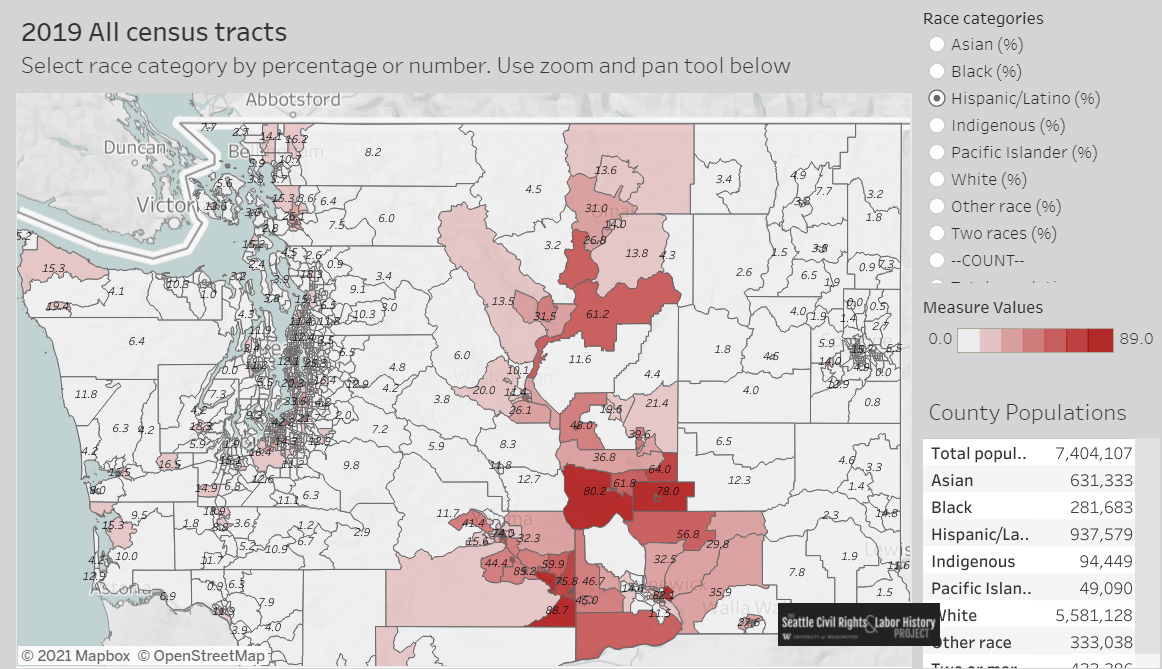
All Counties/ All Census Tracts |
Here we map all of the census tracts in Washington State. Zoom and drag the map to highlight particular cities and counties. Select one of the race categories and move decade by decade to see what has changed since 1980.
|
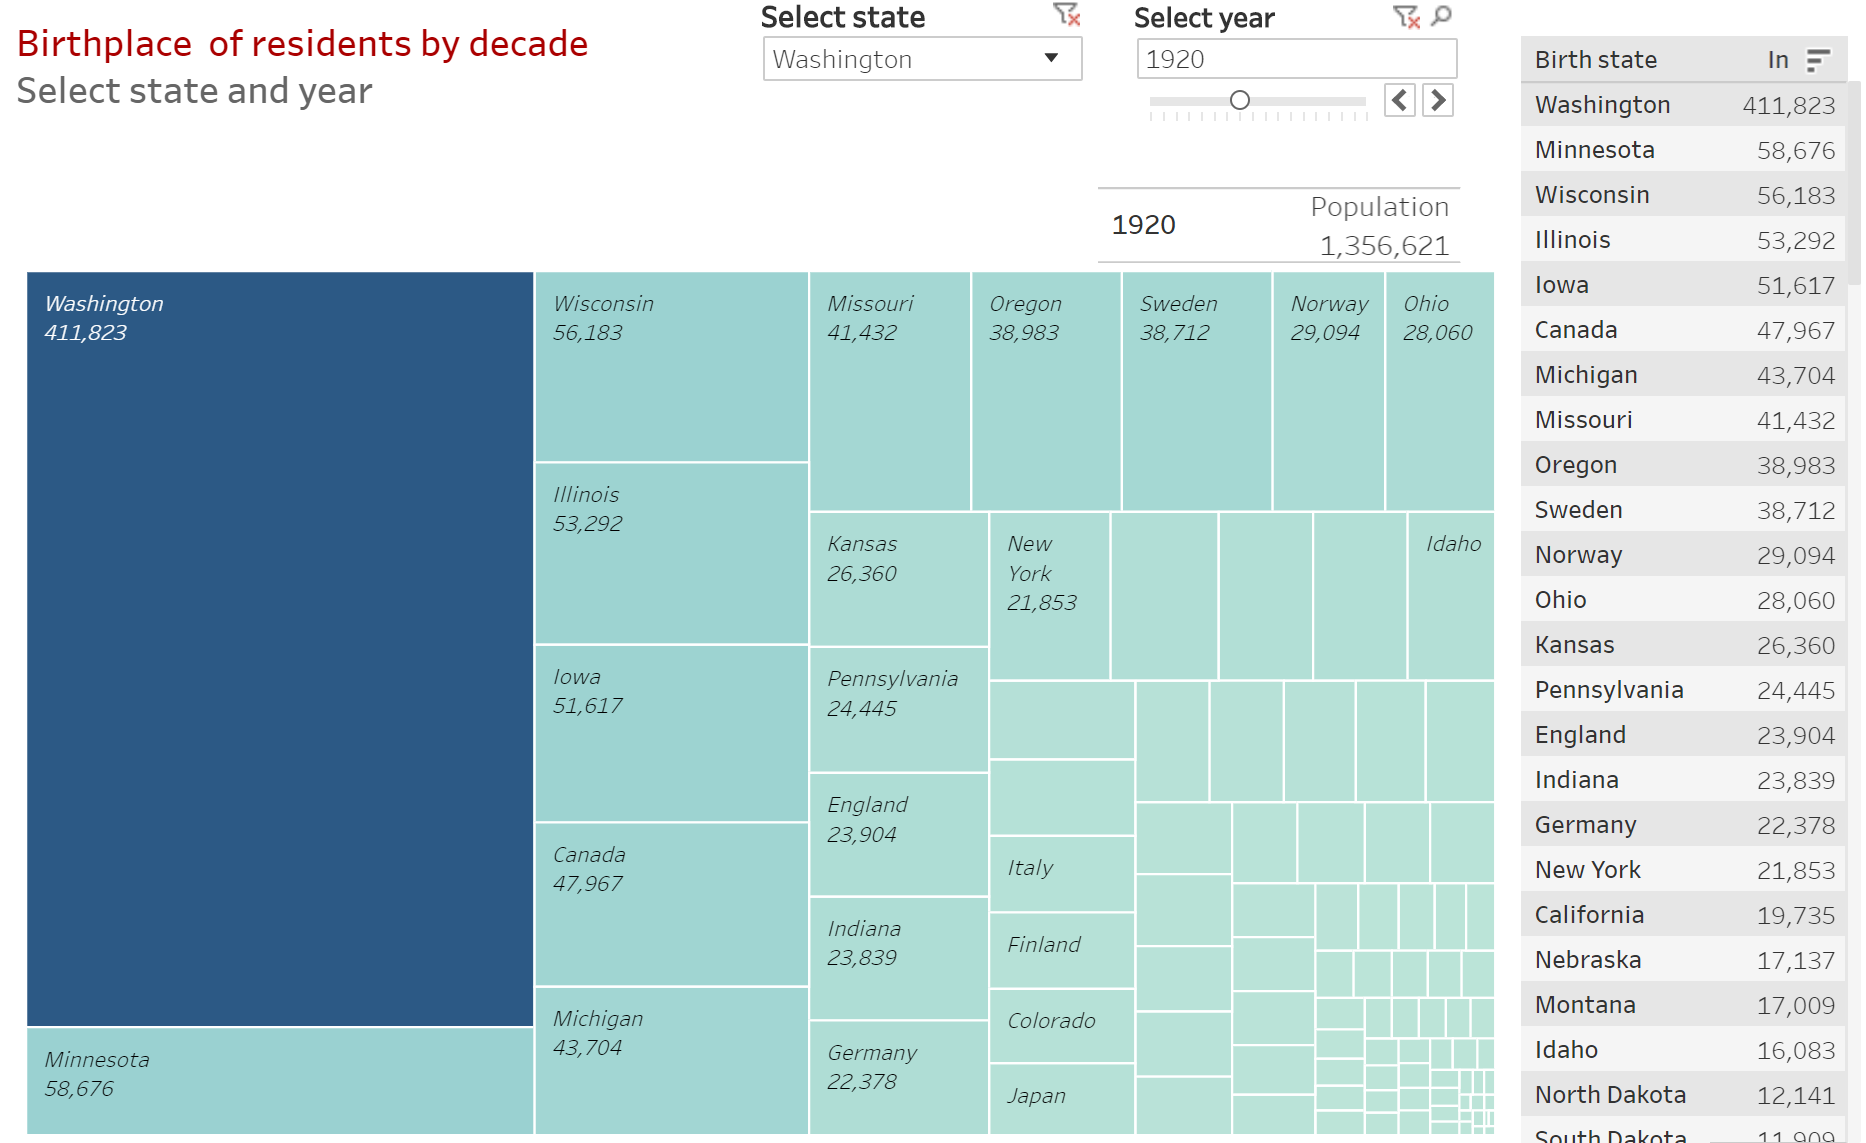
Migration History |
Washington remains today a state where most residents came from somewhere else, another state or another country. With this visualization tool we trace the migration history, showing decade by decade where people have come from. The tool allows us to select by race to track the origins of Asians, Black, Latinos, Natives, and Whites who have settled in Washington. [more]
|
|
|
Directed by Professor James Gregory, the Mapping Washington Labor and Civil Rights project has been supported by a 2016-2017 Washington State Labor Research grant from the Harry Bridges Center for Labor Studies, University of Washington.
Research Associates: Katie Anastas, Josue Estrada, Rebecca Flores, Arianne Hermida
Technology Advisor: Jason Lee Grills
|
|