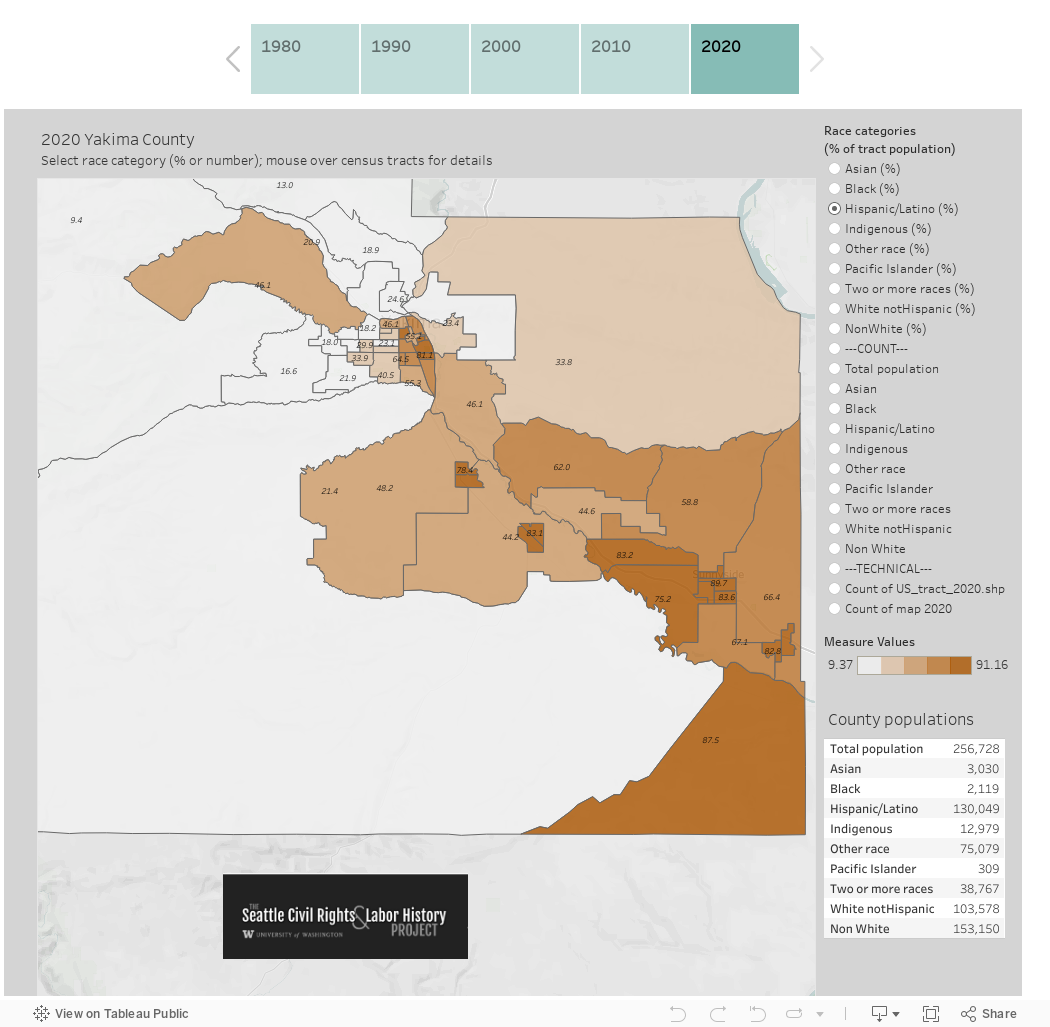
Notes: Data are from the National Historic Geographic Information System (IPUMS). The most recent data is labeled 2020* but to improve accuracy we use an average of five Census Bureau American Community Survey (ACS) samples from 2018-2022.
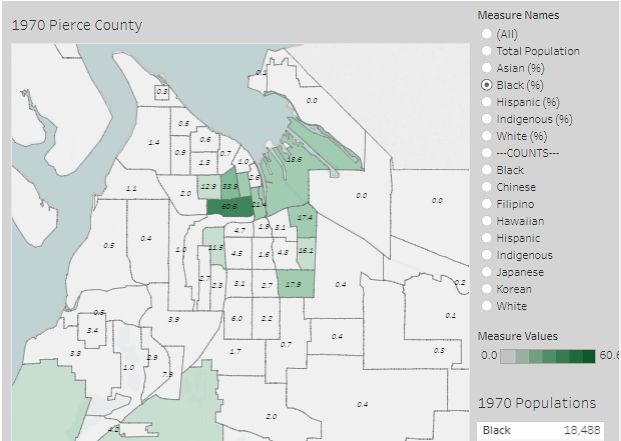
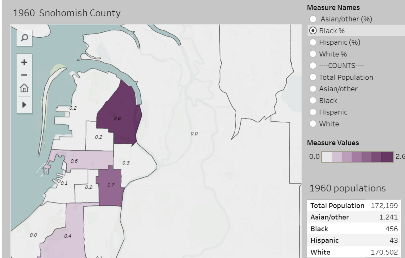
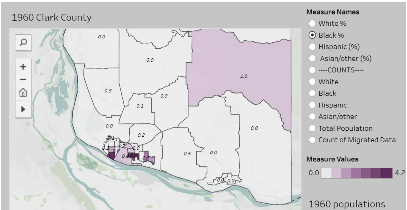
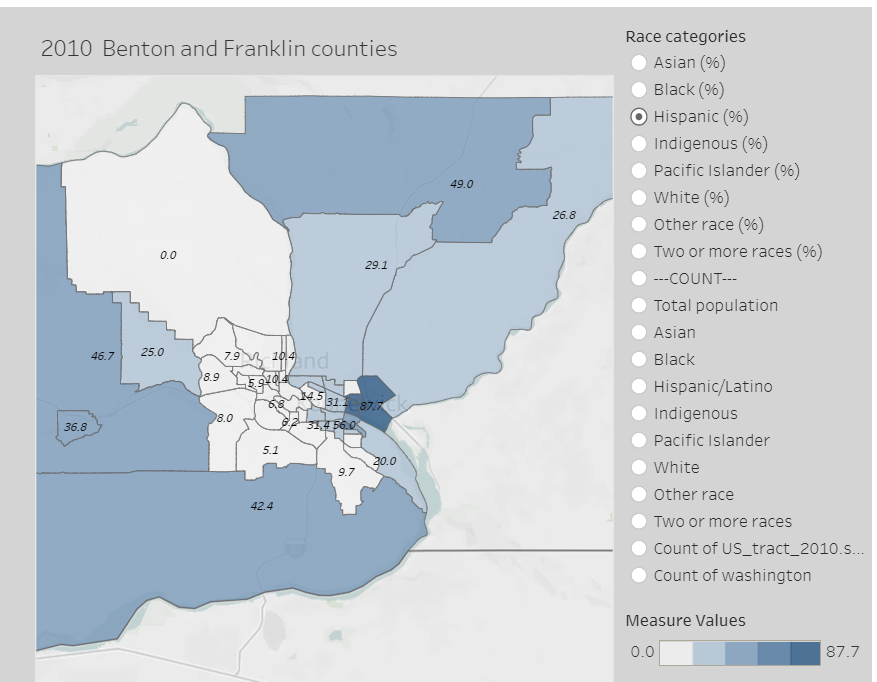
Race categories and census tracts: The Census Bureau adds and adjusts the boundaries of census tracts nearly every decade. It also changes the data it reports and the racial categories. For 1940, all nonwhites were reported as a combined category. In 1950, this became two categories, “Negroes” and “Other races.” Since most of the “others” would have been Japanese, Chinese, and Filipinos with small numbers of Native Americans, we relabeled this as “Asian/other races.” It was not until 1970 that a reliable set of questions identified people of Hispanic heritage. That is also when Indigenous Americans were first identified in census tract data.
Credits: These maps and tables were created by Anna Yoon, Brian Lam, Gihoon Du, Jiang Wu, and Yurika Harada using data and shape files from the National Historical Geographic Information System (NHGIS). The work was a class project for Geography 469 GIS Workshop taught by Professor Sarah Elwood-Faustino Spring 2017. James Gregory added the 2020 maps.
Source: calculated from Steven Manson, Jonathan Schroeder, David Van Riper, and Steven Ruggles. IPUMS National Historical Geographic Information System: Version 12.0 [Database]. Minneapolis: University of Minnesota. 2017. http://doi.org/10.18128/D050.V12.0
Race and Segregation in Washington Cities and Counties 1940-2019
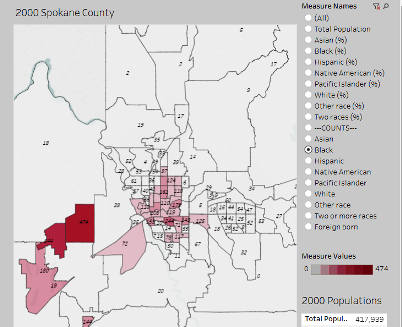
See these maps of race and segregation for other Washington counties.
 |
 |
 |
 |
 |
 |