|
|
| C E S S O F T W A R E G U I D E
|
|||||
|
|
|
Introduction to Using CES Architecture and Database | Find Data | Create Charts | Selection | Saving Information Create Charts Now we know something about the CES software, and its database, but we don't have a way to compare the material properties that fill the CES database. For this comparison we have CES charts. there are two types of charts:
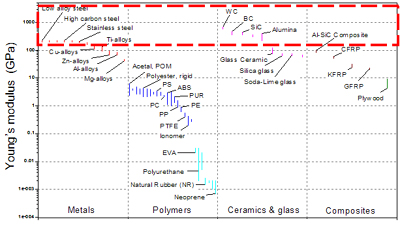
Material bar-charts can help us with exploring relationships and with elementary selection between material classes.
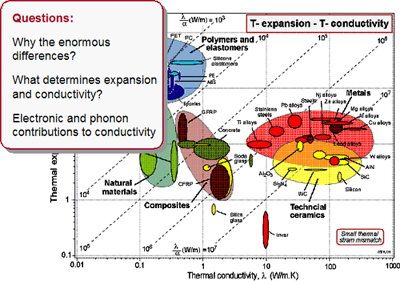
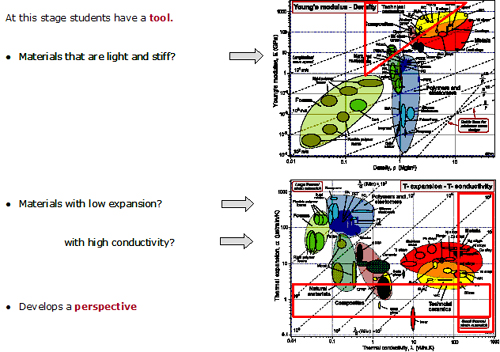
Material Properties Charts can help us with answering questions about materials and be used as a tool in material selection.
To create a chart simply, choose which two material properties that you want to compare (i.e. choose the X and the Y for your graph), and CES generates a graph that compares the materials in the database to each other by your selected two material properties. Check out a example project that shows the how to create a graph in CES: Graph stages |
||
| Copyright © 2006 CES
Information Guide - Materials Science Engineering |
|||||