Restrictive covenants were one of the reasons that people of color found it difficult to live in Kitsap County except in neighborhoods close to the Bremerton Naval Shipyard or on the two Tribal reservations. In 1970, the census counted only 1,451 Black residents. Asian Americans numbered 1,673; Indigenous Americans 913. The county population was 96% white. The tiny numbers speak to something more than racial segregation. Exclusion was the issue. And its history plays out today in homeownership rates, family wealth, and other effects of exclusion and inequality.
The links below lead to three resources featuring different kinds of maps, lists, and information showing the neighborhoods impacted by racial restrictive covenants and the history of segregation and exclusion.
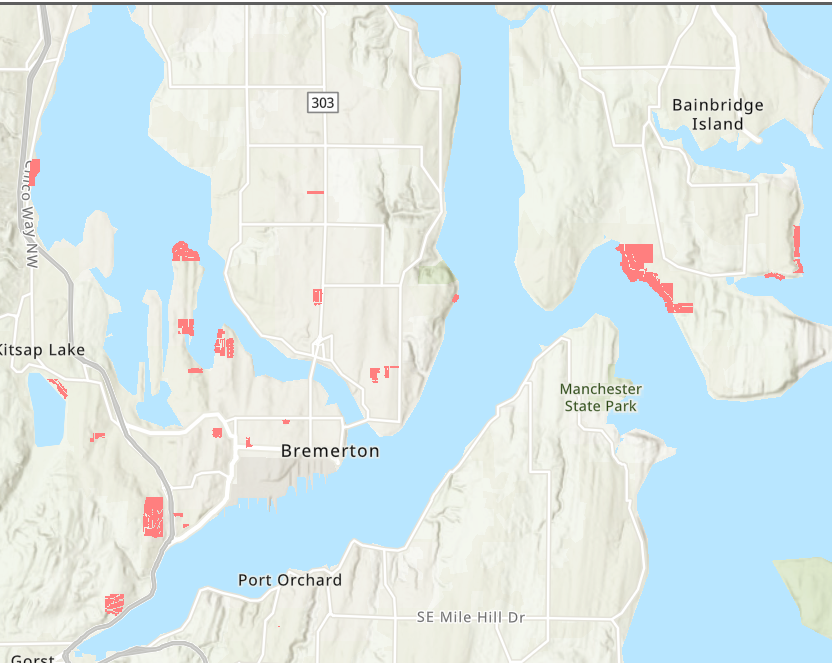
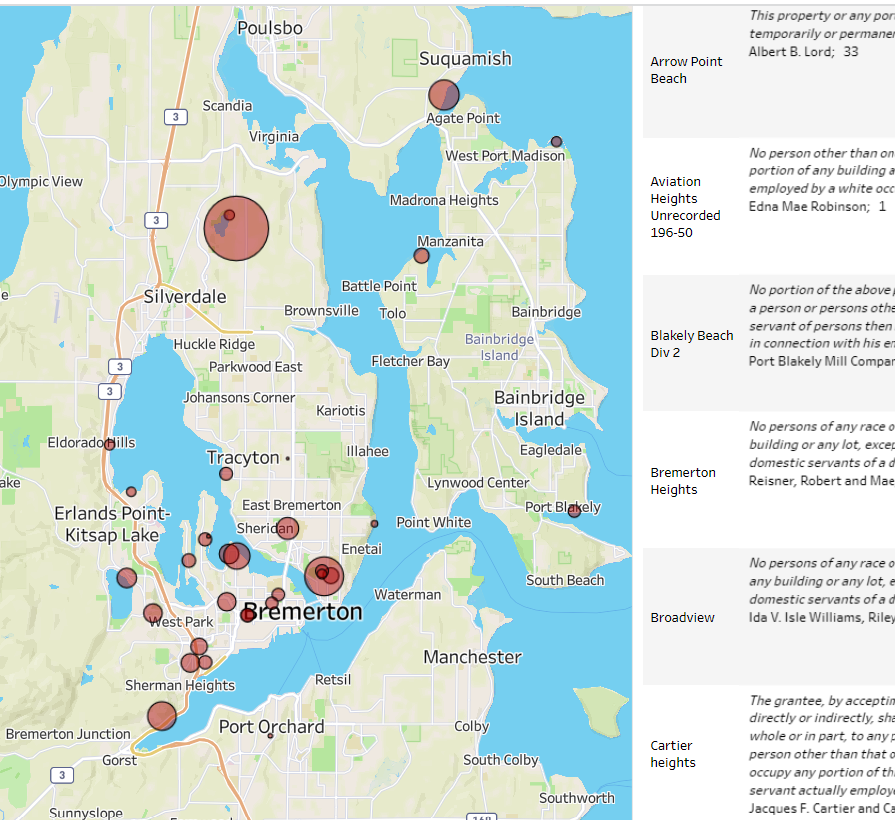
2,000 plus restricted parcels
This interactive map shows the location and addresses of properties that carried racial restrictions. Zoom to see individual parcels, the specific terms of the restriction and the developer who imposed them
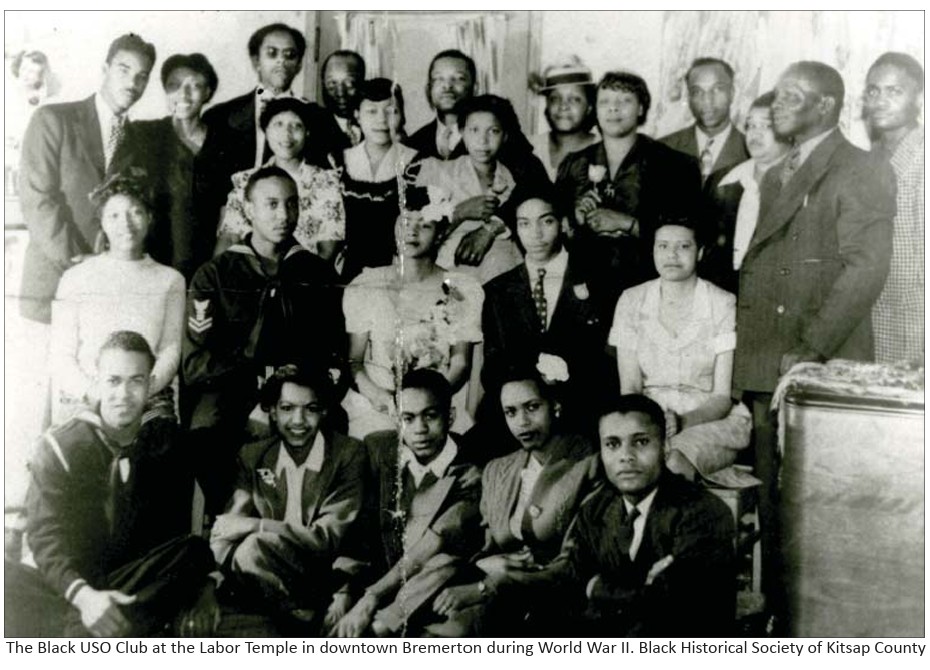
Bremerton/kitsap History of Racial Exclusion, Segregation, and Housing
This essay details the history of racial exclusion in Kitsap County, charting the legal and social enforcement of racial covenants and the struggles against them.
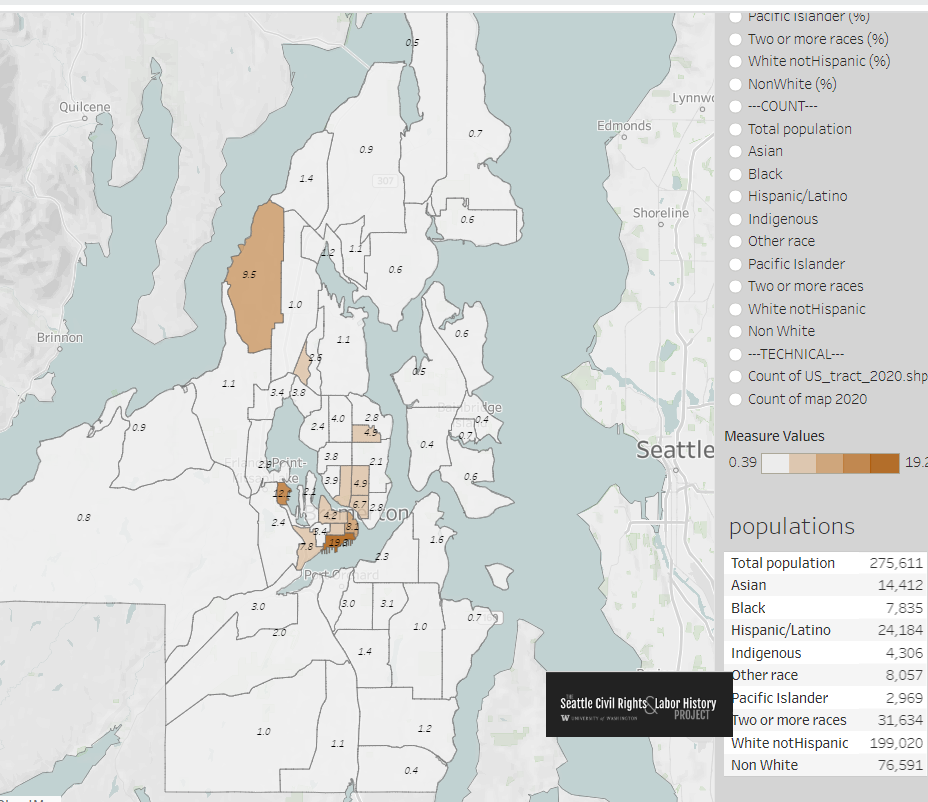
Race and segregation maps
1980-2020
Here we map the neighborhood-by-neighborhood distributions of African Americans, Asian Americans, Indigenous Americans, Latinos, and Whites across four decades.
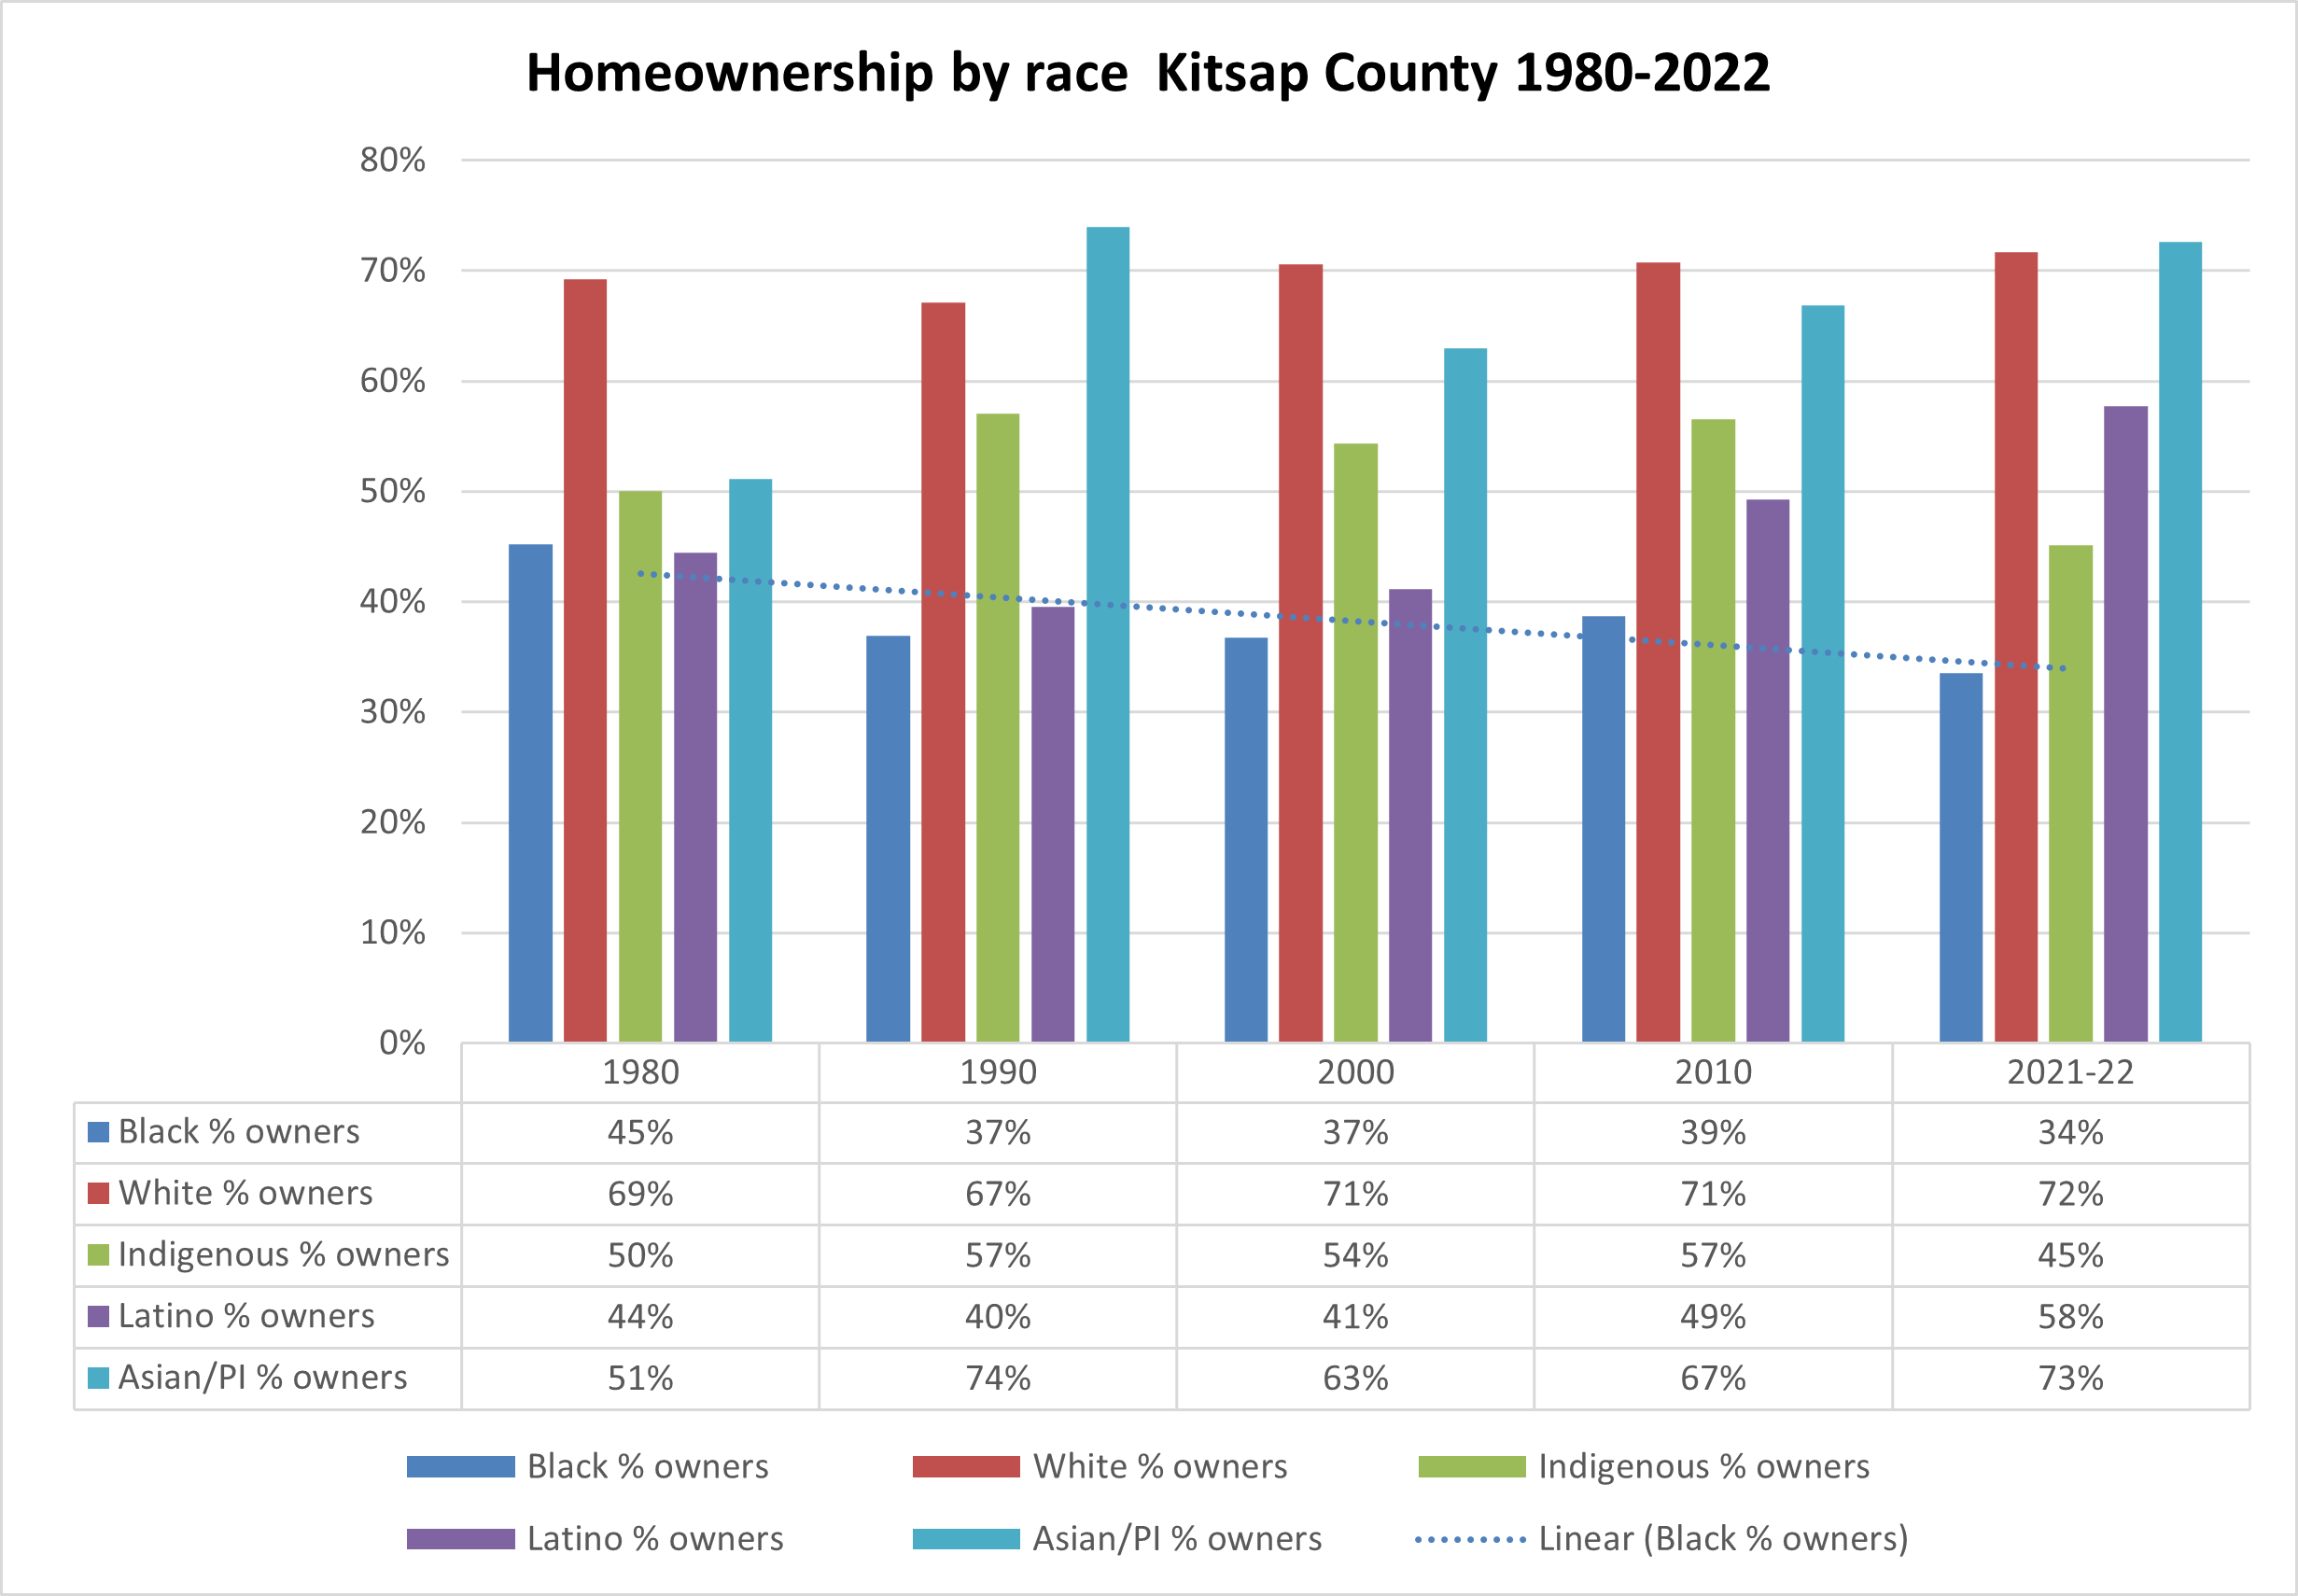
Homeownership by race
1980-2022
Home ownership for Black families in Kitsap County has followed a disturbing pattern in recent decades. While two-thirds of White families are able to own homes, most Black do not. And the trend has gotten worse. In the most recent census reports 72% of White families are homeowners compared to only 34% of Black families.
Restricted subdivisions (with documents)
This map shows 39 subdivisons with known restrictions. Read the language of restrictions, learn the names of the developers.