| Q3. Does the duration of tree influence (over decades to centuries)
affect the potential for restoration of meadow vegetation?
Duration
of tree influence does not appear to constrain the potential for
meadow recovery, at least in the short-term. Forest species declined
and meadow species increased across the broad range of initial vegetation
states, from areas of recent invasion (lower values on the X axis)
to older forests (>140 yr; higher values on the X axis) (figure
below).
Reductions
in forest herbs and increases in meadow species were actually greater
in older than in younger forests (right panel). Meadow species appear
to be dispersing from adjacent openings and areas of recent encroachment
that still support local populations.
That
said, the cover and richness of meadow species are still lower than
in adjacent, uninvaded communities. After centuries of tree influence,
however, it is not surprising that additional time would be needed
to assess whether tree removal is adequate, or if fire is also necessary,
to fully restore community composition and structure.
Local
responses to tree removal and fire
|
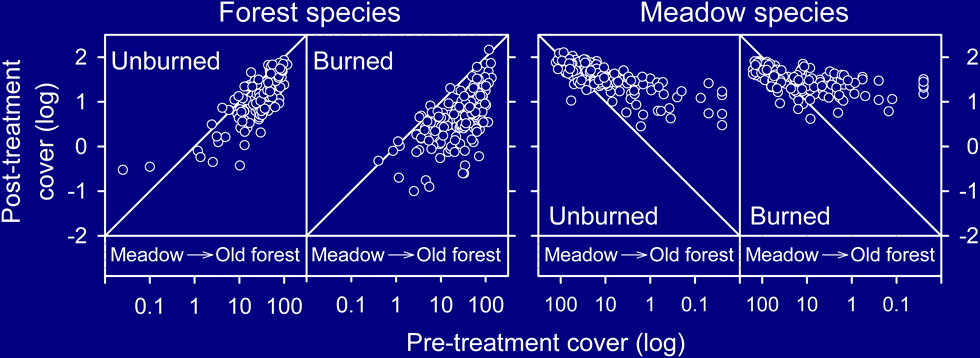 |
| Post-
vs. pre-treatment cover of forest and meadow species among
subplots. Points below the 1:1 line represent declines
in cover, while points above the line represent increases.
Relationships for species richness (not shown) were similar. |
|
|