
| Home |
| 3-D Echo |
| 3-D MRI |
| Applications |
| Quantitative Angiography |
| Centerline™ |
| Visual Guidance |
| Personnel |
| Publications |
| Contact Us |
Techniques for 3D Quantitative Echocardiography
Mitral Annular Dynamics
Mechanism of Functional Mitral Regurgitation
Application: Heart Region Data Viewer
Three-dimensional echocardiography increases the precision with which valve area, valve geometry, and transvalvar flow characteristics are measured. It was through 3D echo that cardiologists confirmed that the fibrous support of the mitral valve is not flat but rather saddle-shaped. By tracing its motion and shape through the cardiac cycle, we learned that it undergoes complex deformation and strain during both atrial and ventricular systole, and that this deformation is linked to valve competence; and that patients with LV dysfunction have characteristic attenuation of this pattern of deformation. This pattern is most evident in examination of the annular curve over the entire cardiac cycle in cine loop format5.
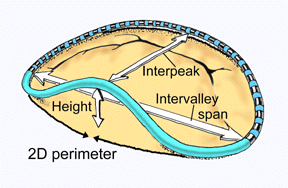 |
Left: 3D conceptualization of the mitral annulus as a nonplanar ring with local maxima anteriorly and posteriorly. Axes of measurement are shown. |
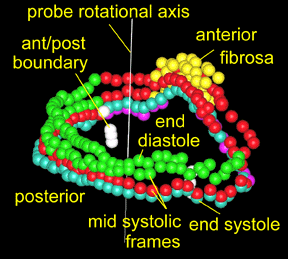 |
Left: Marker points traced along the mitral annulus in several axial planes form a ring. The distance of the ring centroid from the apex depends on the phase of the cardiac cycle. During systole, the ring contracts and folds into a more oblong shape, permitting more secure leaflet closure. |
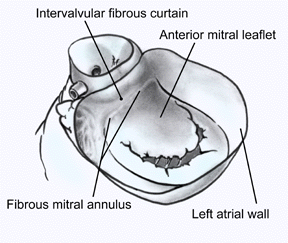 |
Left: Diagram of the mitral valve and its neighbors, viewed from the left atrium. A fibrous curtain of variable length separates the aortic and mitral annuli. |
Functional mitral regurgitation (FMR) is MR that occurs in the absence of structural abnormalities in the mitral leaflets, annulus, chordae, or papillary muscles. It is most commonly seen in patients with poor myocardial function, whether from ischemia, infarction, or cardiomyopathy. Its presence is associated with a worse prognosis; improving survival depends on identifying the root cause more than on repairing the leak; however, at this time the direct cause(s) of FMR are uncertain.Previous studies attributed FMR to left ventricular (LV) or papillary muscle (PM) dysfunction alone, but now implicate mitral apparatus shape distortion. Aikawa et al. at the CVRTC previously related the development and severity of FMR to the widening of the angle between the anterior and posterior chordae. Additional parameters of mitral apparatus geometry are now studied as determinants of FMR severity (below).
METHODS: Transthoracic 3D echo scans were obtained in 8 normal and 13 pts. with dilated cardiomyopathy (DCM), 5 with mild and 8 with moderate-severe FMR.
The mitral annulus was traced at end diastole, end systole, and midsystole and reconstructed in 3D. The chordae originating from the ant. and post. papillary heads were traced to measure interchordal angle.
LV shape was measured as distance from the long axis to 16 regions on the LV wall.RESULTS: The ant. and anterolateral (antlat) wall was more displaced in pts. with mod/severe FMR (p<0.05 vs mild FMR for 6 basal, mid, and apical ant and antlat segments).
Chordae were nearly orthogonal to the leaflets in normals; in DCM pts. chordal-valve plane angle was acute; they also had a greater interchordal angle (p<0.001 for nl vs. mild vs. mod/sev FMR).
In addition, interchordal angle correlated with LV dilatation (p<0.05).CONCLUSION: In pts. with DCM the mechanism of FMR is displacement of the antlat wall with attendant ant. papillary displacement, widening of the interchordal angle, and lateral retraction of the leaflets3.
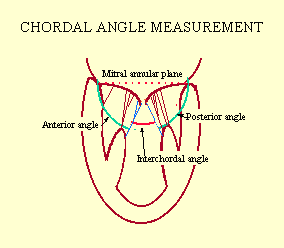 |
Left: Diagram of apical 2-chamber view showing relationships of chordae tendineae to the mitral valve plane and to one another. Angles of interest were measured between primary chordae (at tips of valve leaflets). |
 |
|
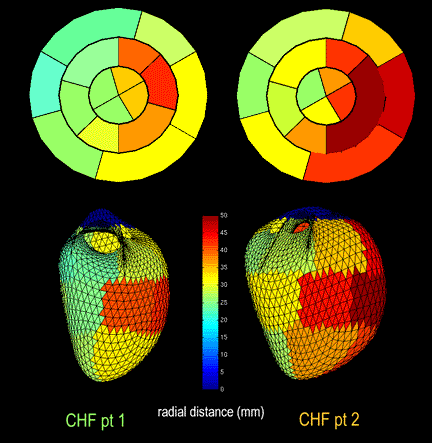
| Left ventricular shape distortion by region. Top row: LV endocardial surface reconstructions for two representative patients with DCM, heart failure, and FMR. Regional average distances from LV center axis are mapped as shown. Bottom row: Flattened projection of mapped segments (outermost ring indicates basal regions; innermost, apical). |
Back to Top