Human-Centered Data Science Lab (HDSL) Blog

Do Substantive Reviews Improve Authors’ Writing? – Mahir Bathija & Kush Tekriwal

Posted by Human-Centered Data Science Lab on June 10, 2021
Fanfiction Data Science, Human-Centered Data Science Lab (HDSL) Blog / Comments Off on Do Substantive Reviews Improve Authors’ Writing? – Mahir Bathija & Kush Tekriwal

Originally posted on June 23, 2019 at https://fanfictiondatascience.tumblr.com/post/185799336200/do-substantive-reviews-improve-authors-writing.

Introduction

The goal of this research is to find further evidence for the benefits of distributed mentoring. Distributed mentoring is “a kind of mentoring that is uniquely suited to networked communities, where people of all ages and experience levels engage with and support one another through a complex, interwoven tapestry of interactive, cumulatively sophisticated advice and informal instruction” [1]. This involves multiple kinds of feedback exchanged between many mentors and mentees. In this research project, we used machine learning to classify Fanfiction.net reviews by their category within distributed mentoring theory.

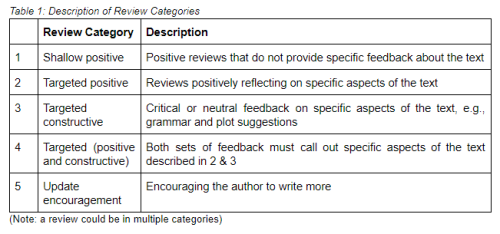
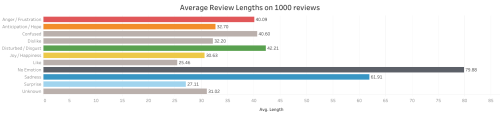
Earlier research in our group published in the paper ‘More Than Peer Production: Fanfiction Communities as Sites of Distributed Mentoring’ has outlined 13 categories that were observed in Fanfiction.net reviews [2]. We used shallow positive, targeted positive, targeted constructive, and targeted positive & constructive for this analysis, as they are the four mutually exclusive codes. Table 1 below provides a formal description and percentage of reviews for each of the categories [2].

Table 1: Description and Percentage of Categories (based on 4500 reviews)

image

(Note: percentages add up to more than 100% because a review could be in multiple categories).

An example of a shallow positive review is “Great story!”, targeted positive is “I loved the character development of James”, and a targeted constructive review is “You could have described the battle scene better!” Targeted positive & constructive reviews contains both targeted positive and targeted constructive comments.

Our overarching research question is “Do certain review categories correlate with various attributes of distributed mentoring?” For example, we want to explore whether substantive, targeted reviews improve authors’ writing. This research would be beneficial to the fanfiction community, as it would provide an outline to members of the community on how to effectively impact and interact with authors. The theory of distributed mentoring is an applicable framework to use, as it discusses the effect of networked communities. To apply this theory, we used the public reviews available in the fanfiction community. Since there are numerous types of reviews, we used the codes listed in Table 1 to classify the reviews.

To classify all Fanfiction.net reviews, roughly 177 million, we explored machine learning classification, as manual coding would be impossible. Classification is a process of predicting the review category for a given set of reviews.

Our goal for this blog was to find the best machine learning model for review classification. We could then use this model to expand our results to the entire Fanfiction.net reviews dataset. Our baseline classification tool was ALOE (Affect Labeler of Expressions), an open source tool developed to train and test machine learning classifiers to automatically label chat messages with different emotion or affect categories [3]. In addition, we attempted various algorithms such as logistic regression, support vector machines, and Naive Bayes. This blog post discusses our approach to running ALOE as well as creating each of the aforementioned machine learning models.

Dataset

To conduct machine classification, we required data to train the model to learn how reviews relate to a certain category. We leveraged a dataset manually classified by previous participants in the UW Human-Centered Data Science Lab research group. Our dataset contained ~8000 manually classified reviews.

Method

The measures of success for performance were accuracy, precision, and recall. Accuracy is the number of correct predictions. This measure, however, can be misleading in classification problems. In the field of data science, we call a positive value true and a negative value false. In this case the value is positive if the review corresponds to the category in question and false otherwise. For example, if a dataset has 99 positive data points and 1 negative data points, a model that predicts only positive would receive a 0.99 accuracy. Therefore, we also used precision and recall to provide a holistic perspective. Precision is ‘how many negative data points did I include in my list of positively predicted examples’, and recall is ‘how many positive data points did I miss’. An average range for precision and recall is 0.6 – 0.7. Anything below 0.6 may signify that the results are not valid while and anything above 0.7 is generally considered a really good score that validates our accuracy.

Figure 1: Image from Wikipedia visually describing Precision and Recall

image


1. ALOE

We were able to run ALOE by following the documentation at https://github.com/etcgroup/aloe.

2. Other Classifiers

2.1 Logistic Regression

Logistic Regression is a method commonly used when the inputs of the model are categories. We experimented with multiple different parameters and sought a set of parameters that yield the best result from the model.

2.2 Naive Bayes

Naive Bayes is a family of machine learning based on applying Bayes’ theorem to calculate certain probabilities. We explored 3 types of Naive Bayes classifiers on the four categories of data. These were the Gaussian, Bernoulli and Multinomial Naive Bayes methods.

2.3 Support Vector Machine (SVM)

SVM is a method to find the best division between two classes. We explored three different SVM models: default, linear, and  optimal. We used a technique to find the best parameters for each of these models.

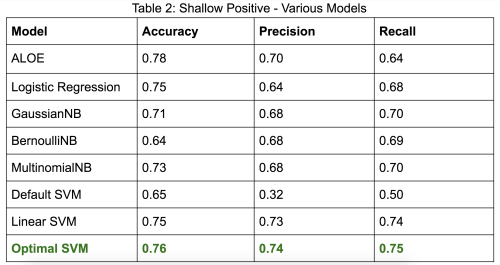
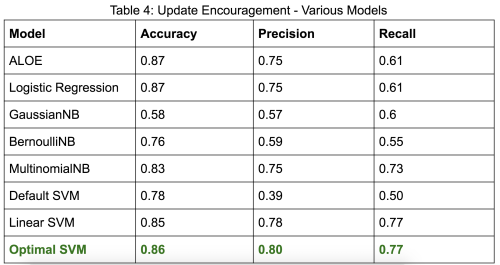
When using the four categories defined above, we received low precision and recall scores for targeted constructive and targeted positive & constructive. Hence we decided to combine the three targeted categories in order to solidify our results. This is because there are very few reviews in the dataset for the latter two categories, and all targeted categories qualify as “substantive” since they provide specific feedback to authors. Consequently, we decided to add the update encouragement category, as 27.6% of our dataset is classified as this code. Update encouragement is a category that represents all reviews that encourage the author to write more [2]. These changes enable a more accurate comparison between the various models.

Results

After these changes, we got the following results for our models on shallow positive, targeted, and update encouragement. All values are representative of percentages, from a scale from 0 to 1.

image
image
image

Conclusion

We will expand these results by classifying the entire Fanfiction.net dataset, 177 million reviews, by using Optimal SVM to predict shallow positive and update encouragement reviews and ALOE to predict targeted reviews. After which, we plan to proceed with our analysis between these review categories and attributes of distributed mentoring such as improvement of writing and participation rate. As a starting point, we will explore whether targeted reviews impact authors’ lexical diversity – which is an indicator of improvement in the authors’ writing and a learning gain from online informal learning. Additionally, we will brainstorm other metrics to measure learning and distributed mentoring. Overall, we are delighted that our changes gave positive results and were able to create models that performed better than our baseline, ALOE. A better model means we can more accurately classify reviews and expand our results to provide a blueprint to the fanfiction community on how to effectively impact and interact with authors.

Citations

  1. Aragon C. Human-Centered Data Science Lab » Distributed Mentoring in Fanfiction Communities Human-Centered Data Science Lab. Depts.washington.edu. https://depts.washington.edu/hdsl/research/distributed-mentoring/. Published 2019. Accessed June 5, 2019.
  2. Evans, S., Davis, K., Evans, A., Campbell, J. A., Randall, D. P., Yin, K., & Aragon, C. (2017, February). More than peer production: fanfiction communities as sites of distributed mentoring. In Proceedings of the 2017 ACM Conference on Computer Supported Cooperative Work and Social Computing(pp. 259-272). ACM.
  3. Brooks M. etcgroup/aloe. GitHub. https://github.com/etcgroup/aloe.

Tags:

A Prototype Review Visualization Tool for the Fanfiction Community – Netra Pathak & Kush Tekriwal

Posted by Human-Centered Data Science Lab on June 10, 2021
Fanfiction Data Science, Human-Centered Data Science Lab (HDSL) Blog / Comments Off on A Prototype Review Visualization Tool for the Fanfiction Community – Netra Pathak & Kush Tekriwal

Originally posted on April 25, 2020 at https://fanfictiondatascience.tumblr.com/post/616410483256328192/a-prototype-review-visualization-tool-for-the.

Authors: Netra Pathak and Kush Tekriwal

Hey there! We’re back, the researchers studying the fanfiction community at the University of Washington’s Human-Centered Data Science Lab. This time around, we’ve created a prototype feedback tool that we hope will be helpful to the fanfiction community. The tool will contain dashboards with concise summary reports and trends of an author’s reviews that may help the author reflect on their writing. We have a personal motivation to enhance the joy of writing, and are interested in hearing what authors think of our prototype tool.

image

Introducing the Concept

We’ve found the fanfiction community provides just the right kind of encouragement with its self-sustaining, distributed-mentoring setting. (Distributed mentoring differs from standard mentoring because it’s shared in small pieces by a large number of people.) This environment improves the writing of many authors but also boosts self-confidence. Hence, we thought that gathering review summaries and offering a reflection tool of all feedback received might be useful. This might help to further improve writing proficiency.

In this part of our study, the overarching research question we have is: “How can visualizations help fanfiction authors further enhance their learning from reviews?”

We’re interested in your feedback on this prototype visualization tool.

Our hypothesis is that providing an author with a holistic overview of all their reviews, customizable to the story or chapter level, may help the author glance over their work and synthesize areas of improvement. We believe learning from the feedback given in a distributed-mentoring community is important, and the technique of visual analytics (interactive visualizations combined with computation and analytical reasoning) can enable authors to recognize their strengths and weaknesses as writers. In addition, these reports may help authors understand why some chapters are received better than others and whether they have any other correlating factors such as time or other factors.

The tool could be extended to the fandom level, so authors could follow other author trends based on common fandoms, etc.

Background Information and Context of Data

We leveraged a dataset collected by the UW Human-Centered Data Science Lab that contains more than 176 million reviews from Fanfiction.net [2]. For our prototype analysis, we only used a subset of the data of authors and their stories and reviews.

For the purpose of analysis, we have machine-classified reviews into a few categories. The review classifications are generated by ALOE (Affect Labeler of Expressions), an open-source tool developed to train and test machine learning classifiers to automatically label chat messages with different emotions or affect categories [3].

In regard to this blog post, a review can fall into one or more of the 5 categories. Table 1 below provides a description for each of the 5 categories [1] and Table 2 provides sample reviews for each of the 5 categories.

image
image

Review Trend Dashboards in the Tool

Below are the screenshots of some of the dashboard screens in the feedback tool. Through these dashboards, we hope each author can explore the story of their journey in the fanfiction community. Please be informed that as the data is sensitive, we have anonymized our results.

Differential privacy techniques have been used and the number of reviews in all figures do not represent any individual author’s actual count. Also, in Fig 4 and subsequent figures, the story ID and/or author ID do not represent the actual ID on fanfiction.net.

The first three screenshots focus on review types and trends of an individual author over time. We thought it would be interesting for authors to see the trends of the types of reviews they have been receiving over the entire year or on a weekly/monthly basis. This can enable them to analyze their peaks and dips, relate them to any external events, etc.

image

Fig 1: Overall review trend for one particular story of an author based on different review types over a time period of one year. (The trend can also be seen for all stories together, where the number of reviews equals the sum of all reviews of all stories.) Hovering over a data point gives the details in a tooltip.

In Fig 2, Fig 3 and Fig 6, stacked bar charts are used to show a larger category divided into smaller categories and what the relationship of each part has on the total amount. For example, different review categories as part of reviews received over a month (i.e. a larger category). In that case, each bar represents a whole (all reviews received in a month/week), and segments in the bar represent different parts (review categories) of that whole. Hovering over a segment of the bar chart highlights details specific to the segment.

image

Fig 2: Review type breakdown of all the stories of a particular author over time (weekly). Time can be customized to be at a weekly, monthly or yearly level. Please note, the review categories here are not mutually exclusive which results in an increased number of reviews for a few types.

image

Fig 3: Review type breakdown of the stories of a particular author over time, with the review categories being mutually exclusive. Time can be customized to be at a weekly, monthly or yearly level. 

Now, combining the above screens in one dashboard, we can either see the review breakdown and its trend for all stories together or for each story differently. For each story, we can also see the estimated chapter published dates and link them to the review dates. Hence, this way the dashboard is customizable to reflect either all stories or at story/chapter level.

image
image

Fig 4: The dashboard contains the review breakdown in multiple categories, as well as the estimated chapter published date for a single story of an author. The above results are for a particular author ID 317330 (all IDs are anonymized) for a single story ID 936798 (blue highlighted) and similarly, we can see for each of the individual story IDs or for all stories together (see Fig 5 below). 

image

Fig 5: The dashboard contains the review breakdown in multiple categories, as well as the estimated chapter published date for stories of an author. These stories are ordered by the number of reviews received by that particular story of the author. Here, it may be assumed that the stories that have received the highest number of reviews are the popular stories for the author.

The final dashboard below enables authors to see at a glance the number of reviews of each of their stories, while also being able to juxtapose their stories. Every author will have stories that receive more reviews and ones that receive fewer, and these dashboards may give them the ability to learn which story characteristics may lead to a greater number of reviews.

image

Fig 6: The dashboard gives informative review details for all the stories of an author. We can see the number of reviews received monthly and the review categories breakdown for each story of an author. This dashboard potentially gives the ability to analyze which stories were a success and received a lot of update encouragement and positive feedback, while on the other hand, which stories received critical acclaim, constructive feedback, etc.

Does Analysis Matter?

There is an obvious question in mind while seeing these visualizations and data trends: How does the analysis help? How is this reflection beneficial? Just like how customer feedback is crucial for future product development and improvement, no matter the size of the organization; similarly it doesn’t matter if I am an author starting out, a well-versed author mid-way in my writing experience, or a proficient author. Analysis provides a better view of what needs to be changed or improved, if any, whether you are an individual, or represent a group, business or company. Such information can be used to make informed decisions. For example, in the context of fanfiction, for a starter it may be useful to know what kind of stories are read and reviewed more and why, what kind of plots are acknowledged more, etc. For an author who has written multiple stories, it may be useful to know which stories received maximum appreciation to continue using similar components and keep up his/her fanbase.

However, all said and done, these are just our speculations! We want to know what you think! We want to know from you if such analysis is helpful to the fanfiction authors, or if you would like some changes. We would love to pivot in the direction that is most useful for you.

That’s a Wrap

As we deliver this system of dashboards, we hope to create a positive impact by highlighting the trends and summary reports of review types for the stories of an author. For example, new authors in the community may be able to observe trends such as an increasing number of update encouragement reviews and in turn might feel encouraged to write more. :D

The tool and the dashboards are a medium to see feedback from other authors and readers over time.

We will also be encouraged if we get feedback from you. Please share your thoughts and comments so we can learn about your likings as well! To validate our research, we would also love to work with members in the fanfiction community and know whether our solution is effective or not. We would like to extend this work based on the responses we receive.

This is it for now! In the coming months we will develop more dashboards and post them as there are a plethora of questions we can ask this data. Heartfelt thanks for taking a look at our prototype. If you have any questions or want clarification on any of the data, please don’t hesitate to reply to this post, reblog with a comment, or send an ask. We’ll be happy to clear up any confusion the best we can!

Acknowledgments

We would like to express our deepest gratitude towards Prof. Cecilia Aragon and Jenna Frens at the Human-Centered Data Science Lab for their useful critiques, ideas, constant guidance and enthusiastic encouragement of this research study. It was an honor to work with them.

Additional Information

Earlier research in our group, published in the paper ‘More Than Peer Production: Fanfiction Communities as Sites of Distributed Mentoring’ has outlined 13 categories that were observed in Fanfiction.net reviews [1]. 

1. Evans, S., Davis, K., Evans, A., Campbell, J. A., Randall, D. P., Yin, K., & Aragon, C. (2017, February). More than peer production: fanfiction communities as sites of distributed mentoring. In Proceedings of the 2017 ACM Conference on Computer Supported Cooperative Work and Social Computing(pp. 259-272). ACM.

2. Aragon C. Human-Centered Data Science Lab » Distributed Mentoring in Fanfiction Communities. https://depts.washington.edu/hdsl/research/distributed-mentoring/. Published 2019. Accessed June 5, 2019.

3. Brooks M. etcgroup/aloe. GitHub. https://github.com/etcgroup/aloe

4. University of Washington, Human-Centered Data Science Lab » Research »Distributed Mentoring in Fanfiction Communities. https://depts.washington.edu/hdsl/research/distributed-mentoring/

Tags:

Fanfiction Community Survey Part 1: Overview of Results – Ruby Davis

Posted by Human-Centered Data Science Lab on June 10, 2021
Fanfiction Data Science, Human-Centered Data Science Lab (HDSL) Blog / Comments Off on Fanfiction Community Survey Part 1: Overview of Results – Ruby Davis

Originally posted on January 6, 2019 at https://fanfictiondatascience.tumblr.com/post/181788901675/hi-im-ruby-and-im-part-of-a-group-of.

Hi! I’m Ruby, and I’m part of a group of researchers studying fanfiction communities through the University of Washington’s Human Centered Data Science Lab.
In November of 2017, we sent out a survey to all of you to learn a bit more about what...

Hi! I’m Ruby, and I’m part of a group of researchers studying fanfiction communities through the University of Washington’s Human Centered Data Science Lab.

In November of 2017, we sent out a survey to all of you to learn a bit more about what motivates folks to participate in fanfiction communities, what kinds of activities you all participate in, and where your communities are. It’s been a hot minute, but I finally have some results to share!

We were absolutely blown away by your enthusiasm filling out our survey. We got a total of 1,888 responses from all over the world, which was way more than we ever could have imagined. Thank you all so much!

In this blog post, I’ll give a quick overview of participant demographics and fan experience data. Then I’ll finish off with a preview of a few more blog posts to come!

Demographics

Survey participants’ demographic information matched well with previous fanfiction community censuses. (1234) If you’re familiar with fandom spaces, this section shouldn’t be too much of a surprise.

Gender

The following chart represents the gender distribution of our participants. These percentages are not cumulative! Participants could check as many identities as applied to them.

image

Gender identities that fall under the nonbinary and genderqueer umbrellas were aggregated for the purpose of this chart, but a comprehensive distribution will be shared in a more robust demographics post later on. Stay tuned!

Age

The age distribution of participant was pretty typical of fanfiction communities. This chart expresses the distribution as percentages. Children under 13 were excluded from filling out the survey.

image

Location

We collected some general location data and found that most of our participants were from the United States and Europe. That said, participants answered our survey from all over the globe. Here’s a map of where our participants were from.

image

(Please click for full-size!)

This map was created by aggregating coordinate data into different “buckets” based off of how close those locations were to one another. Each of the colored circles on the map represents one of these “buckets”. Any coordinate within a certain distance from the epicenter of each circle is included in the total displayed at the center of that circle.

To put that in context, the red circle over Germany doesn’t mean that there are 349 participants from Germany—it means that there are 349 participants from various locations around Europe, with the center of that bucket being located in Germany.

Blue circles represent buckets of 10 or fewer participants, yellow circles represent buckets of 100 or fewer participants, and red circles represent buckets of more than 100 participants.

Fandoms

Participants represented a great spread of different fandoms. Keep in mind that these results are from November 2017 through January 2018, so the fandoms represented in this word cloud are the ones that were popular among participants a year ago.

image

This word cloud only includes fandoms that were listed by ten or more participants. Although we did combine synonyms of fandom names (e.g. BNHA, My Hero Academia, MHA, etc. are synonyms of Boku no Hero Academia) we did not do any “meta-categorizing” (e.g. making Boku no Hero Academia a synonym of “Anime”). Therefore, the only fandoms included here are ones that were listed explicitly.

Fan Experiences

The biggest part of our survey delved into the activities that people in fanfiction communities participate in. We’ll give some more in-depth analysis of this data later, but for now, here’s a taste.

Personal History

First off, let’s talk about experience in terms of time. The following chart shows how long participants have been involved with online fanfiction communities.

image

Please keep in mind that each of these brackets are different sizes. The first bracket, “1 – 2 years”, represents only a 2-year span, while the fourth spans 10 years.

Which Fanfiction Communities?

Fans who filled out our survey were mainly based on tumblr and AO3, and most had used FanFiction.Net in the past. This is good to keep in mind, because the results from fans who favor other communities—say, Wattpad—might look very different. There is no one monolithic “fanfiction community”.

image

Activities

A significant portion of our survey questions asked participants to indicate how often they do various fanfiction-related activities. Although the complete list of activities was a lot longer, for this first overview post we’re just going to focus on three: reading fanfiction, writing fanfiction, and commenting on fanfiction.

Unsurprisingly, reading fanfiction was the most popular activity among our participants. About two-thirds of participants read fanfiction every day. Only 5 participants (0.3%) indicated that they’d never read fanfiction.

image

As for writing fanfiction, the distribution is much more even across the five frequency options. About a third of participants write fic at least once or twice a week, while another third write fic more infrequently (a couple times a month or less). The final third had not written fic or were no longer writing fic at the time of the survey.

image

Leaving comments or reviews on fanfiction was a fairly ubiquitous activity. Nearly all participants (88.8%) reported that they do at least occasionally leave comments or reviews. Almost half of participants (46.7%) left comments at least once or twice a week.

image

What’s Next?

Now that I’ve shown you all a sample of the results from the survey, what else is there to see?

In the coming months, my research team and I will continue to post about additional findings from the survey results. Some of these posts may cover topics such as:

  • Demographics and activity information by fandom
  • Comparing age and different activities in fanfiction communities
  • Expanded demographic information, especially for gender

In addition, we have a significant amount of data from long responses to our survey question, “What motivates you to participate in fanfiction communities?” Participant responses were incredibly rich and detailed, and there’s a lot of fantastic information to draw from them.

For now, that’s a wrap! Thanks for taking a look at our results. If you have any questions or want clarification on any of the data shared here, please don’t hesitate to reply to this post, reblog with a comment, or send an ask. I’ll be happy to clear up any confusion, if I can.

May the force be with you all, 

Ruby Davis 
Human-Centered Data Science Lab 
University of Washington

Tags: ,

Building Connections through Shared Emotions on Fanfiction.net

Posted by G on February 22, 2021
Human-Centered Data Science Lab (HDSL) Blog / Comments Off on Building Connections through Shared Emotions on Fanfiction.net

Author: Sourojit Ghosh

As a creative writer myself, I’ve always been anxious about getting reviews on the content I put out there. As I’m sure others who publish any form of writing can attest to, reviews form an integral part of our development as writers. However, I also find myself paying attention to not just what a review says, but also how it is said. Specifically, the emotions expressed in a review often shape my interpretation of it.

With that in mind, we at the University of Washington Human-Centered Data Science Lab (UW-HDSL) are interested in researching the emotions present in the multitude of reviews by the fanfiction community. By investigating a correlation between the lengths of reviews and the emotions expressed in them, we aim to understand the growth of relationships between members of the community as they share likes and dislikes.

Introduction

Our previous research with the fanfiction community has found widespread encouragement for budding relationships in its distributed-mentoring setting. The members of the community, mostly young adults from all over the world, are incredibly expressive in their words and often eager to support each other in the writing process. Most of the reviews we have seen in the community are rife with emotion, with the words jumping off the page with their expressiveness. This collectively supportive environment not only seeks to bring out the best in each individual but also to form meaningful relationships that extend beyond that of anonymous writers and readers of fanfiction.

Methods and Findings

For this exploration, we examined 1000 reviews of various fanfiction stories published on the site. We decided to classify them as exhibiting one of 11 emotions: Like, Joy/Happiness, Anticipation/Hope, Dislike, Discomfort/Disgust, Anger/Frustration, Sadness, Surprise, Confused,  Unknown, and No Emotion. Figure 1 shows an example of a review coded in this way using TextPrizm, a  web tool developed by members of the UW-HDSL.

image

Figure 1: An example of a review being coded for emotions

By coding these reviews for emotions, we are trying to gain a better understanding of the trends in emotions expressed by reviewers across the community. By identifying such trends, we hope to learn how relationships are formed between users sharing common interests and having similar reactions to certain content.  

Figures 2 and 3 display our preliminary results so far. Figure 2 represents the number of reviews being classified as having each emotion, while Figure 3 shows the average lengths of reviews in the dataset expressing each emotion.

image

Figure 2: A bar graph showing the no. of reviews each emotion was assigned to.

image

Figure 3: A bar graph showing the average no. of words in a review expressing each emotion.

The high number of reviews expressing Joy / Happiness and Like is an encouraging indication of the fact that most users took adequate time to express their positivity and support towards the writers. Another emerging trend can be seen in the reviews marked as No Emotion. This small number of reviews averaging at about 80 words per review was found to contain thoughtful discussions on global issues like religious tensions and sexual violence. While the previously discussed reviews highlight the positivity inherent in the community, these reviews remind us of the incredible maturity and depth of thought that the members also possess, a fact even more inspiring given that the community is mostly comprised of young adults.  

Conclusion and Future Work

This initial examination of a small set of reviews offers some insight into the correlations between emotions and review length. An exploration of a larger set of reviews may offer some basis for providing statistically significant findings along the lines of the currently observed trends and can provide further insight into the ways in which reviews are integral in the process of users on relationship building on Fanfiction.net.

We would love to hear from you, members of the fanfiction community, about what you think of our work and how you view the emotions expressed in reviews of your writing. At the same time, we would also be interested in knowing if you express certain emotions in your reviews more extensively than others! If you have any questions or concerns about our data, feel free to respond to this post or send up an ask, and we would be happy to get back to you. And, as always, stay tuned for our future work with your wonderful fanfiction community!

Acknowledgments

We are incredibly grateful to Dr. Cecilia Aragon and undergraduate researcher Niamh Froelich at the UW Human-Centered Data Science Lab for the initial ideas behind the project, their insightful feedback, and constant support throughout the process. We are also grateful for the fantastic Fanfiction.net community, which continues to prosper each day and exist as a positively supportive environment for budding and seasoned writers alike.

From Flash Teams to Flash Fiction

Posted by Cecilia Aragon on January 13, 2015
Human-Centered Data Science Lab (HDSL) Blog / Comments Off on From Flash Teams to Flash Fiction

When Andrés Monroy-Hernandez invited me to the Microsoft Research FUSE Labs 2015 Social Computing Symposium, I was thrilled.

Then he said, “We thought it would be fun to have a debate about the utopian and dystopian views around crowdsourcing. We’ll have [brilliant crowdsourcing expert] Michael Bernstein taking the utopian side. How would you like to take the dystopian side and lead off with a 10-minute presentation?”

Uh… thanks, Andrés?

Say again what you thought my qualifications in crowdsourcing were?

After the vision of being publicly humiliated subsided, I found myself saying, “That sounds like too much fun.”

So I wrote a science fiction story.

I figured I’d need to read it out loud in 8 minutes. At my normal reading rate of 150 words per minute, that gave me 1200 words to play with. In other words, flash fiction territory. Perfect.

(Recent work by Michael and his team at Stanford, Expert Crowdsourcing with Flash Teams, won a best paper award at UIST 2014.)

Thanks again to Andrés and Michael for an awesome session, including fantastic work on crowdsourcing by Niloufar Salehi, Meredith Ringel Morris, Yanni Antonellis, and Michael Galpert, as well as a discussion led by crowdworkers from TaskRabbit, AMT, and oDesk. (More details and video at http://scs.fuselabs.org/.)

Afterwards, some folks asked me to post my crowdsourcing dystopia, so here it is.


Green or Not At All

I was born in debt.

Well, all children are, nowadays in the 2070s. It costs money to install an Oracle RFID, a Google Eye. The surgery is delicate, on a newborn.

But it has to be done. How else would you survive? No way to connect to the net, no way to work, no way to earn your living. No way to pay for food, water, air. Since the Taxation Ban of 2041, signed into law by the first World Bank president, a fundamental tenet of our Constitution has been that no free citizen should be required to pay for another’s upkeep. We are all free to make our own future, to live without the onerous burden of providing for someone else too lazy to work.

So as kids, we start getting out of debt as soon as possible. We’re lucky that, with the passing of the Children’s Freedom Act of 2049, co-sponsored by the oil senators, we’re now legally allowed to work from birth.

I was four when I worked my first hit. My parents were so proud of me. They told me my debt counter had gone down for the first time in my life. They pointed out the blinking red numbers on my wrist, but I didn’t really understand yet. All I knew is that I’d flicked my Eye over the Dasher just like I’d been practicing, and eyetyped in the blurry numbers I read from the image captcha on my eyescreen.

Sixty seconds of work, and it earned me my first dollar. My mom smiled for the first time that week and took me into her warm arms for a big hug, and my dad tapped my head with his knuckle, saying “This brain works.” My debt counter, which had barely reached a megadollar by then, had taken its first downward step.

The first of many, I vowed.

When I was old enough for kindergarten, every day I would skip down the hall from our cube to the elementary school on corridor B6, scan my wrist RFID at the big blue door, get it debited for my daily education charge, and join a hundred kids from our neighborhood sitting at carrels learning to read, eyetype, do math, and program; or if we were lucky, playing on the shaggy orange rug in front of the Window.

Just like all the other kids, I loved pressing my nose to the Window and looking out over the city. As far as the eye could see, tall buildings speared up into the pale brown sky until their edges were lost in the distance, shimmering in the heat. The sun glared down like an old-time furnace, and you could feel its searing blaze even through the thick filtered plexiglass. Every now and then, an Outside worker in all their protective gear would come rappelling down past the glass, waving at the children who clustered around in excitement.

“I’m going to work Outside when I’m grown,” bragged Willy, a tall boy whose debt counter was, amazingly, below a megadollar.

Kim sniffed. “You’ll never be able to afford the gear,” she scoffed. Nobody looked at her. Everyone knew Kim had the highest debt counter in the class. How she would dig herself out of that hole enough to qualify for a loan on the hugely expensive Outside gear, especially when everyone knew she was behind on her hit homework, was pretty much impossible. She didn’t work enough hits fast enough even to pay for her education, much less start slowing her debt counter’s ballooning growth.

But still, we all had big dreams. Don’t all kindergartners? I worked all my hit homework and then some, studiously avoiding the game tab on my Eye until I had surpassed my goal for the day. Still, my debt counter crept slowly upward. School, food, oxygen, all took their daily bites out of those numbers on my wrist. I just wasn’t good enough, at six years old, to work the higher-paying hits. But I played the hit lottery each day, dreaming of that magical hit that would make me a big winner.

“Play the Amazon Lottery! It only takes one hit to win! Imagine your debt counter, and your entire family’s, being reset to zero. You too could join these lucky winners in the world of green numbers!” The images of laughing families proudly displaying their wrists with the astonishing winking green of the rich flashed across my Eye, and I sighed and closed my eyes to work faster.

I would be rich one day. Anybody could be rich if they worked hard enough, if they earned a high enough rating to qualify for the more lucrative hits. Of course, you had to be careful. At six years old, Kim had already been blacklisted by many of the major corporations for doing poor quality work. If her rating kept going lower, she wouldn’t ever have a chance to get out of debt. And even worse, she might be crowdshunned, blacklisted by other workers, who didn’t want to work a team hit with her. Once you were crowdshunned, that was it. There was no chance of turning the numbers around. When she turned eighteen and couldn’t stay with her parents anymore, she would be kicked out of their cube and sent to one of the lower floors, where they couldn’t afford to pay for hallway air conditioning and where the oxygen levels were low. I’d been there on field trips, seen the people slumped in hot, dim corners, their wrists blinking red with unimaginably high numbers, and returned with a headache from lack of oxygen, sweaty and scared.

But I was going to be rich. Not only would I be rich, I would be an Employee one day, actually drawing a salary from JP Morgan, or Comcast, or Microsoft. My favorite net show was “Green Employees,” a sitcom about a group of friends who worked in one of the domes, played games on real grass, swam in pools and had private toilets, who actually received money every week that made their green numbers go up. The main character was a kid who had once been just like us. Just like me, he lay in his slot at night with the panel closed and worked hits until he fell asleep.

The villain of that show was a terrorist, who had once been the friend of the main character when they were kids. But he had tried to get the workers of their neighborhood to organize, to refuse to work hits that he said paid too little. But that made the requesters complain that if their labor costs went up too high, they would go out of business and stop creating jobs. They started withholding hits to that neighborhood. So the other workers crowdshunned the terrorist and he ran away, hiding somewhere in the city and trying to sabotage his former classmate. The main character was always getting in trouble because he had a soft spot for his terrorist friend.

As I caught the latest episode on my Eye while standing in line for the toilet one morning, I grimaced at the antics of the main character. When I grow up, I’ll never act soft like that.

After all, I’m from an upper-middle-class family. We have a responsibility to those less fortunate.

Tags: ,

Highlights of the First Annual CHI Play Conference

Posted by Daniel Perry on November 11, 2014
Human-Centered Data Science Lab (HDSL) Blog / Comments Off on Highlights of the First Annual CHI Play Conference

ParticipatoryDesignWorkshop

The Participatory Design Workshop at CHI Play

Posted by PhD student Daniel Perry

In late October I attended the first annual conference on Computer-Human Interaction in Play (CHI Play 2014) in Toronto. The conference brought together some 150 researchers, academics, and game designers across numerous areas of serious game research and HCI. Sessions at the conference covered a variety of topic areas, including collaboration and communication in serious games, games for health, gamification and education, and game analytics. Research I conducted on co-design with high school youth for the bioinformatics educational game MAX5 was one of several accepted abstracts in a workshop titled Participatory Design for Serious Game Design.

The Participatory Design for Serious Game Design workshop marked one of the highlights of the conference for me, as it brought together participants from all over the world (Malta, Belgium, Germany, Taiwan, Canada, and the U.S to name just a few) to explore the philosophical and methodological challenges of integrating participatory design and serious games. Participatory design (PD) has its roots in Scandinavia some forty years ago as way to empower workers and involve them more directly in the software design process. PD techniques have been adapted and used in a variety of fields and contexts with communities ranging from toddlers to the elderly. While PD often works hand-in-hand with user-centered design approaches, PD’s focus on directly integrating participant design concepts takes a more democratic stance on the design process. In the workshop, we worked in small groups mapping the field of participatory design as we saw it in our own research on games. Topics that emerged included: the use of PD to design games, as well as the use of games as a methodological way to design other types of software systems; the challenge of conveying domain knowledge to participants for learning games (in my own research, this involved getting high school youth up-to-speed with biology and computer science topics in our game); and deciding what design outcomes should be integrated into the final game. While there were no easy answers that came out of the workshop, the importance of transparency in design, as well as providing a tangible sense of participant contribution came up as important issues to address. It was exciting to feel that in many ways we were putting forth a new global agenda for the future of PD in serious games research.

Another highlight of the conference included a keynote by Mike Ambinder, an experimental psychologist at Valve Software (the Seattle-area company behind a host of game favorites including Portal and Left for Dead). In his talk, Mike discussed the current state of the art in gathering game data, and the frequent biases and challenges inherent in the process. He encouraged the audience to imagine the tools and methods that would fill in the data gaps in an ideal research world. I was left with the impression that if a game powerhouse like Valve was facing a daunting data landscape, there is much to gain from further discussions between industry veterans and the academic researcher community. I’m looking forward to attending CHI Play next year.


Hacked Ethnographic Fieldnotes from Astro Hack Week

Posted by Cecilia Aragon on October 29, 2014
Human-Centered Data Science Lab (HDSL) Blog, Uncategorized / Comments Off on Hacked Ethnographic Fieldnotes from Astro Hack Week

First posted at the Astrohackweek blog

What is data science ethnography anyway?

As an ethnographer of data science, I immerse myself in particular communities to understand how they make sense of the world, how they communicate, what motivates them, and how they work together. I spent a week at astro data hack week, which might as well have been a foreign culture to me. I participated as an active listener, trying to sensitize myself to the culture and discern patterns that may not be self-evident to people within the community. Ethnography can have the effect of making the ordinary strange, such that the norms, objects, and practices that the community takes for granted become fascinating, informative sites for learning and discovery. Many of the astro hackers were probably thinking, “Why is this woman hanging around watching me code on my laptop? There is nothing interesting here.” But I assured them it was interesting to me because I was seeing their everyday practice in the context of a complex social and technical world that is in flux.

Ethnography can be thought of as a form of big data. Typically hundreds of pages of fieldnotes, interview transcripts, and artifacts from the field would be recorded over a long period of time until the ethnographer determines they have reached a point of saturation. The analysis process co-occurs with the data collection, iteratively shaping the focus of the research and observation strategy. Across this massive dataset with an abundance of unwieldy dimensions, the ethnographer has to make sense. The ethnographer works with members of the community to help them interpret what they are observing. Ethnographic insights, what many may term “findings”, emerge as patterns and themes are detected. Theory and new questions are generated, rather than tested. In this process I also acknowledge my own biases and prior assumptions and use them as ways to probe deeper and understand through them rather than ignore them. For instance, I came to astro data hack week not understanding much of anything people were talking about. It made me prone to feeling intimidated and I recognized with this intimidation my own reticence to ask questions. My own experience with this feeling helped me identify in others that were also feeling variations of this and also be able to identify what helped transform that feeling throughout the week into a more comfortable and curious state.

I only spent 5 days among the community of astro hackers, but in the spirit of hacking, I have a few “hacked” fieldnotes to share. Sharing is a key component of the hack week and as a participant I feel it is important to follow suit. But bear in mind these thoughts are preliminary. So, what have I been working on this week?

Initial descriptive observations from an outsider (a little tongue-in-cheek, forgive me):

  • Astro hackers live in a very dusty, dirty, and noisy environment! Very hard to keep clean and elaborate measures are taken to obtain a signal. But when the signal is too strong or the data too clean, there is a feeling of mistrust.
  • The common language is Python, although there are many other dialects, some entirely made of acronyms, others sound like common names, such as George and Julia.
  • When talking there is always some form of data, documentation or model that mediates the conversation, whether it is on the white board, on the screen, or through representational gestures.
  • Although most people are studying something that has to do with astronomy, they can literally be operating on “different wavelengths”!
  • Astro hackers play with “toys” and “fake data” as much as “real world data”!
  • Coffee and beer fuel interactivity!

Themes


Josh Bloom teaches Machine Learning

Data science at the community level: From T to Pi to Gamma-shaped (Josh Bloom’s term) scientists: Across the group I heard over and over again in various ways reference and deference to those who are more expert, those who are smarter or those who know more than I do. Granted, this is a somewhat common occurrence in the culture of academia as we are continuously humbled by the expertise around us. However, I found this particularly acute and concentrated within this community. What I heard across students, postdocs, and research scientists was more than the typical imposter syndrome. It was the feeling that they are expected to be experts or at the very least fluent in a range of computing and statistical areas in addition to their own domain. While this motivates people to be at a hack week such as this, it can also have the unintended effect of making people intimidated and overwhelmed with having to know everything themselves. This can have a chilling effect across the community. This means the feeling that other people know more than they do is pervasive and this often leads to thinking their questions aren’t valuable for the rest of the group, and therefore, not worth sharing. This is a negative thing and we want to ensure this effect is minimized. Not only is it bad for morale; it is bad for science. We should consider who feels comfortable taking a risk in these settings? A risk might be asking a question that they fear isn’t scientifically interesting for others. Or sharing something that isn’t complete or isn’t perfect. If we take what Josh Bloom says, that we might be better off thinking about data science on the community level, happening in a more distributed way, rather than data science on the individual level, we can begin to paint a different picture and change some of the expectations that may trigger this negative effect.

Josh Bloom’s lecture on machine learning explained the popular idea of “Pi-shaped” individuals (a buzz word for the academic data science community) and his preference, for talking about “Gamma-shaped” individuals. Rather than promote the idea that there is an expectation of individuals having expert-level depth in two domains, which is unrealistic for the majority of people, what if we thought of people as Gamma-shaped? These people would have expert-level depth in one domain and also be versed and proficient in other domains. Someone with their PhD in biology may be conversant in the language and culture of computer science enough to have conversations and collaborate, but they don’t necessarily need to be an expert in computer science to the extent that they are able to advance the discipline. These Gamma-shaped individuals can work with each other to bridge multiple domains of expertise. This Gamma symbol better reflects the makeup of individuals in this astro hack week community and this view of data science allows for the expectations to shift to the community and to the collaborative interactions between people. This shift is important and has implications for thinking about how to better structure hack week. For instance, with these tweaked expectations a learning goal of the hack week might be working together across Gamma-shaped individuals.

Categorizing hacking interactions I categorized the different kinds of hacking interactions I observed over the course of the week. This list is not meant to be exhaustive, but it might be helpful in understanding the diversity of interactions and how to facilitate the types of hacking interactions desired.

  • Resource Seeking: An individual works on their hack idea and uses other people as sources of expertise when they need help
  • Asymmetical Synergy: A pair or small group joins together to work on a hack idea in which one person is learning something, such as an algorithm, and the other has more advanced knowledge and is exploring what that algorithm can do. They are generating something together but getting different things out of the activity.
  • Symmetrical Synergy: A pair or small group joins together to work on a hack idea and iteratively discovers how their expertise informs the other, or how interests synergize. Then, they generate something new together.
  • Comparing Notes: An individual works on their hack idea and shares it with others based on their common interest. A form of comparing notes in which they are talking about the work more broadly and loosely.
  • Learning Collective: A semi-structured activity that draws multiple people in to learn something collectively, thus creating a learning collective.

The Importance of “Connective Tissue”

Across this community there is great diversity across institution, dataset, data source, methodology, computing tools and packages, statistical approach, status within academia, and level of knowledge in different arenas. This creates many opportunities for discovering connections, for sharing, and working together. Yet this also presents challenges for forging these connections especially within the broader academic environment which in many ways doesn’t incentivize collaboration and “failing fast”. Failing fast refers to the capacity to be highly experimental, to take risks, and invest a little bit often, such that when things don’t work, it is framed much more as part of the iterative process rather than as a significant loss. In a culture where people are failing fast, people are more likely to take risks and learning can happen more rapidly.

A key and essential role that emerged this week was the set of capacities for facilitating connection across people and ideas, what Fernando Perez has called the “connective tissue”. There is a need both the people and the organizational structure that supports social and technical resonances across a wide range of people and can facilitate connections among them. These people can play a role of translation across ideas that might appear otherwise unrelated. They also provide coaching (as opposed to teaching) to help both identify and achieve their goals. We should all be learning from these people so that we can all contribute to the connective tissue. This connective tissue developed further throughout the week. Specifically, the more semi-structured collective learning activities and the emphasis on working in pairs greatly increased the productivity across the group (there was more to show at the end of the day) and the interaction (fewer people with earphones in and more talking). I also observed many more small and big shared victories. I hadn’t yet seen a high five and I saw two instances on Thursday, which reflected the overall sense that the victory was about more than an individual completing the hack, rather it was shared and celebrated together.

This hack week performs as a kind of lab space where people can take risks and work together in new ways that they might not be incentivized to do otherwise. It is an opportunity to change the incentives for a short period of time. In fact, the frictions that we see emerge in this hack week (i.e. people needing to work towards publications) reflect some of the default incentives clashing with hack week incentives. For future hack weeks it might be important to advocate failing fast through normalizing it and facilitating a supportive environment for risk taking. In addition, part of the goal of a future hack week might be more explicitly to learn about how to work together and what it takes to develop connective tissue through incentivizing a range of different hacking interactions.

Work Life Balance

Posted by Katie Kuksenok on October 13, 2014
Human-Centered Data Science Lab (HDSL) Blog / Comments Off on Work Life Balance

During the first meeting of the new quarter, our lab meeting consisted of each member talking about what they did this summer: be it professional achievement or a personal one. We laughed together. We ate pizza and a root vegetable medley made by one of the students, as per last year’s tradition to share food during meetings which had to be during mealtimes due to our excessively overwhelming schedules. We applauded for especially noteworthy remarks, such as: making a plan to graduate soon (2x), submitting a paper to the most recent Big Deal Conference deadline (4x), getting married (1x),and managing to have an actual honest-to-goodness vacation (3x). In our meetings for the last few years, we have allowed the unrelated to seep in, and I think it has improved both the variety and the caliber of our work. Instead of seeing these asides as distractions, we engaged with each other about a huge variety of research topics, as well as human topics.

In my own multi-year struggle with work-life balance (aka, “four years of grad school”), I have found it useful to have one core assumption. Even though I work on a million of seemingly-unrelated projects, they are necessarily and fundamentally related: because they are mine, and are built on the same body of knowledge. In this sense, every intellectually-stimulating conversation that grabs my attention is, by definition, relevant. It is relevant to my perception of the world, and I take note of it. Incidentally, when I began to pursue this sense of “wholeness,” it helped to ease the dreaded (and all-too-common) “impostor syndrome,” the haunting sense of being found out as far less competent than I appear. On the one hand, yes, with anything that I do, there are many people in the world who are much better at that thing than I am. But they are all not me, they do not have the combined idiosyncratic background I bring to the table: the whole has more creative variety to draw from than the sum of its parts. So I can feel both more secure in myself, and relieved that there is always someone to save you from excruciating (and boring) intellectual solitude with advice, feedback, and debate.

“How did you get over anxiety during giving talks?” one of the students asked Cecilia in an aside in a meeting a few years ago. “Well, when you’ve flown a plane straight at the ground at 250 mph at an airshow with hundreds of thousands of people watching, it’s difficult to be too stressed out about other things.” Professor Aragon leads our lab, teaches classes, and occasionally shares what she learned from the time she was an aerobatic champion. Instead of viewing “work life balance” as something of a separation between our “work” selves and our “life” selves, we’re building empathy within the group, as well as sharing with one another our wonderful variety of experiences and lessons.

Oberlin Winter Term 2013

Posted by Katie Kuksenok on April 02, 2013
Human-Centered Data Science Lab (HDSL) Blog / No Comments

For the month of January, three Oberlin College undergraduates – Dan Barella, Sayer Rippey, and Eli Rose – joined SCCL to work on extending our command-line tool for affect detection using machine learning, ALOE. The Winter Term internship was initially conceived by Katie Kuksenok, one of the two Oberlin alumni in SCCL; the other, Michael Brooks, also helped in mentoring the students while they were on campus.

obies2013

Each of the visiting Obies contributed a new functionality and compared its performance to that reported in our CSCW report; Dan implemented a novel segmentation algorithm, Sayer extended feature extraction to process French chat messages rather than only English, and Eli worked on HMM classification. Having returned to Oberlin, Sayer continues to work on analyzing the French portions of the dataset as an independent research project, collaborating over distance.

It has been an incredible month. Besides being blown away by the Seattle public transit system, I got to learn so much about machine learning, language, and grad school, and I got to meet a lot of smart, passionate, inspiring people.
The work I did applying the ALOE pipeline to French was completely fascinating. It was great because I got to be doing something very practical, trying to get the labeler working for the rest of the pipeline, but it also brought up some really interesting differences between French and English.

– Sayer Rippey

So, here I am at the end of Winter Term. I’m already nostalgic! This project was really enrapturing, and the whole experience thoroughly enjoyable. … I will say that, I’m proud of the work I’ve done. There are some places where I know there’s room for improvement, but to believe otherwise would perhaps be worse. I can’t claim that it’s all perfect, but I can claim that I did nearly all that I set out to do, and then some that I hadn’t expected to do. I didn’t expect I’d have to put together a profiling script to test my project, and yet this turned out to be one of the most invaluable tools I’ve had for code analysis (hopefully for others as well). I didn’t expect to find such a subtle tradeoff between a small tweaking of time variables, and yet this became a central issue of the last two weeks of my project. I didn’t think comparing pipeline statistics would be so nuanced, but now I’m beginning to see all the ways that a visualization can change the way people perceive information. I could go on, but what I’m really trying to say is: I learned so many new things!

But the most exciting parts of this Winter Term were not the components of my project. They were the incredible people at the SCCL, who brought me to lectures and talks on the nature of artificial intelligence and information visualization, who always provided novel viewpoints and provoking discussions, who were dedicated to sharing their unbelievable experience in so many topics. I was honored to work with Eli, Sayer, Katie, Michael, Megan, Cecilia, and the rest of this great team. They’ve humbled and challenged me, and for that I thank all of them; as this term comes to a close, I hope only that I should be so lucky in pursuit of future endeavors as I was in finding this one. So to everyone at the SCCL, so long, and thanks for all the fish!

– Dan Barella

Trends in Crowdsourcing

Posted by Katie Kuksenok on April 09, 2012
Human-Centered Data Science Lab (HDSL) Blog / No Comments

These several recent years have seen the rise of crowdsourcing as an exciting new tool for getting things done. For many, it was a way to get tedious tasks done quickly, such as transcribing audio. For many others, it was a way to get data: labeled image data, transcription correction data, and so on. But there is also a layer of meta-inquiry: what constitutes crowdsourcing? Who is in the crowd, and why? What can they accomplish, and how might the software that supports crowdsourcing be designed in a way to help them accomplish more?

Each of the last two conferences I have attended, CSCW2012 and UIST2011, had a “crowdsourcing session,” spanning a range of crowdsourcing-related research. But only a short while before that, the far bigger CHI conference contained only one or two instances of “crowdsourcing papers.” So what happened in the last few years?

At some point in the last decade, crowdsourcing emerged both as a method for getting lots of tedious work done cheaply, and a field of inquiry that resonated with human-computer interaction researchers. Arguably, this point historically coincided with the unveiling of Amazon Mechanical Turk platform, which allowed employers, or “requesters,” to list small, low-paid tasks, or “human-intelligence tasks (HITs)” for anonymous online contractors, or “workers,” to complete. In Amazon’s words, this enabled “artificial artificial intelligence” – the capacity to cheaply get answers to questions that cannot be automated.

Continue reading…