fanfiction

Do Substantive Reviews Improve Authors’ Writing? – Mahir Bathija & Kush Tekriwal

Posted by Human-Centered Data Science Lab on June 10, 2021
Fanfiction Data Science, Human-Centered Data Science Lab (HDSL) Blog / Comments Off on Do Substantive Reviews Improve Authors’ Writing? – Mahir Bathija & Kush Tekriwal

Originally posted on June 23, 2019 at https://fanfictiondatascience.tumblr.com/post/185799336200/do-substantive-reviews-improve-authors-writing.

Introduction

The goal of this research is to find further evidence for the benefits of distributed mentoring. Distributed mentoring is “a kind of mentoring that is uniquely suited to networked communities, where people of all ages and experience levels engage with and support one another through a complex, interwoven tapestry of interactive, cumulatively sophisticated advice and informal instruction” [1]. This involves multiple kinds of feedback exchanged between many mentors and mentees. In this research project, we used machine learning to classify Fanfiction.net reviews by their category within distributed mentoring theory.

Earlier research in our group published in the paper ‘More Than Peer Production: Fanfiction Communities as Sites of Distributed Mentoring’ has outlined 13 categories that were observed in Fanfiction.net reviews [2]. We used shallow positive, targeted positive, targeted constructive, and targeted positive & constructive for this analysis, as they are the four mutually exclusive codes. Table 1 below provides a formal description and percentage of reviews for each of the categories [2].

Table 1: Description and Percentage of Categories (based on 4500 reviews)

image

(Note: percentages add up to more than 100% because a review could be in multiple categories).

An example of a shallow positive review is “Great story!”, targeted positive is “I loved the character development of James”, and a targeted constructive review is “You could have described the battle scene better!” Targeted positive & constructive reviews contains both targeted positive and targeted constructive comments.

Our overarching research question is “Do certain review categories correlate with various attributes of distributed mentoring?” For example, we want to explore whether substantive, targeted reviews improve authors’ writing. This research would be beneficial to the fanfiction community, as it would provide an outline to members of the community on how to effectively impact and interact with authors. The theory of distributed mentoring is an applicable framework to use, as it discusses the effect of networked communities. To apply this theory, we used the public reviews available in the fanfiction community. Since there are numerous types of reviews, we used the codes listed in Table 1 to classify the reviews.

To classify all Fanfiction.net reviews, roughly 177 million, we explored machine learning classification, as manual coding would be impossible. Classification is a process of predicting the review category for a given set of reviews.

Our goal for this blog was to find the best machine learning model for review classification. We could then use this model to expand our results to the entire Fanfiction.net reviews dataset. Our baseline classification tool was ALOE (Affect Labeler of Expressions), an open source tool developed to train and test machine learning classifiers to automatically label chat messages with different emotion or affect categories [3]. In addition, we attempted various algorithms such as logistic regression, support vector machines, and Naive Bayes. This blog post discusses our approach to running ALOE as well as creating each of the aforementioned machine learning models.

Dataset

To conduct machine classification, we required data to train the model to learn how reviews relate to a certain category. We leveraged a dataset manually classified by previous participants in the UW Human-Centered Data Science Lab research group. Our dataset contained ~8000 manually classified reviews.

Method

The measures of success for performance were accuracy, precision, and recall. Accuracy is the number of correct predictions. This measure, however, can be misleading in classification problems. In the field of data science, we call a positive value true and a negative value false. In this case the value is positive if the review corresponds to the category in question and false otherwise. For example, if a dataset has 99 positive data points and 1 negative data points, a model that predicts only positive would receive a 0.99 accuracy. Therefore, we also used precision and recall to provide a holistic perspective. Precision is ‘how many negative data points did I include in my list of positively predicted examples’, and recall is ‘how many positive data points did I miss’. An average range for precision and recall is 0.6 – 0.7. Anything below 0.6 may signify that the results are not valid while and anything above 0.7 is generally considered a really good score that validates our accuracy.

Figure 1: Image from Wikipedia visually describing Precision and Recall

image


1. ALOE

We were able to run ALOE by following the documentation at https://github.com/etcgroup/aloe.

2. Other Classifiers

2.1 Logistic Regression

Logistic Regression is a method commonly used when the inputs of the model are categories. We experimented with multiple different parameters and sought a set of parameters that yield the best result from the model.

2.2 Naive Bayes

Naive Bayes is a family of machine learning based on applying Bayes’ theorem to calculate certain probabilities. We explored 3 types of Naive Bayes classifiers on the four categories of data. These were the Gaussian, Bernoulli and Multinomial Naive Bayes methods.

2.3 Support Vector Machine (SVM)

SVM is a method to find the best division between two classes. We explored three different SVM models: default, linear, and  optimal. We used a technique to find the best parameters for each of these models.

When using the four categories defined above, we received low precision and recall scores for targeted constructive and targeted positive & constructive. Hence we decided to combine the three targeted categories in order to solidify our results. This is because there are very few reviews in the dataset for the latter two categories, and all targeted categories qualify as “substantive” since they provide specific feedback to authors. Consequently, we decided to add the update encouragement category, as 27.6% of our dataset is classified as this code. Update encouragement is a category that represents all reviews that encourage the author to write more [2]. These changes enable a more accurate comparison between the various models.

Results

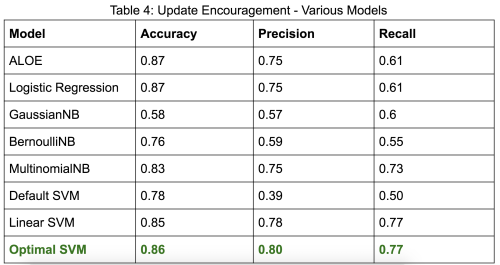
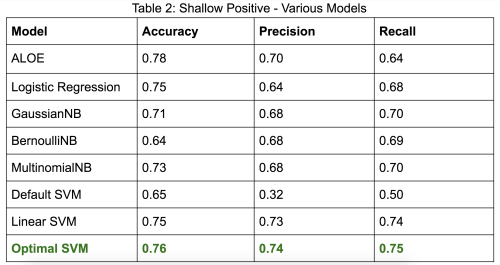
After these changes, we got the following results for our models on shallow positive, targeted, and update encouragement. All values are representative of percentages, from a scale from 0 to 1.
image
image
image

Conclusion

We will expand these results by classifying the entire Fanfiction.net dataset, 177 million reviews, by using Optimal SVM to predict shallow positive and update encouragement reviews and ALOE to predict targeted reviews. After which, we plan to proceed with our analysis between these review categories and attributes of distributed mentoring such as improvement of writing and participation rate. As a starting point, we will explore whether targeted reviews impact authors’ lexical diversity – which is an indicator of improvement in the authors’ writing and a learning gain from online informal learning. Additionally, we will brainstorm other metrics to measure learning and distributed mentoring. Overall, we are delighted that our changes gave positive results and were able to create models that performed better than our baseline, ALOE. A better model means we can more accurately classify reviews and expand our results to provide a blueprint to the fanfiction community on how to effectively impact and interact with authors.

Citations

  1. Aragon C. Human-Centered Data Science Lab » Distributed Mentoring in Fanfiction Communities Human-Centered Data Science Lab. Depts.washington.edu. https://depts.washington.edu/hdsl/research/distributed-mentoring/. Published 2019. Accessed June 5, 2019.
  2. Evans, S., Davis, K., Evans, A., Campbell, J. A., Randall, D. P., Yin, K., & Aragon, C. (2017, February). More than peer production: fanfiction communities as sites of distributed mentoring. In Proceedings of the 2017 ACM Conference on Computer Supported Cooperative Work and Social Computing(pp. 259-272). ACM.
  3. Brooks M. etcgroup/aloe. GitHub. https://github.com/etcgroup/aloe.

Tags:

A Prototype Review Visualization Tool for the Fanfiction Community – Netra Pathak & Kush Tekriwal

Posted by Human-Centered Data Science Lab on June 10, 2021
Fanfiction Data Science, Human-Centered Data Science Lab (HDSL) Blog / Comments Off on A Prototype Review Visualization Tool for the Fanfiction Community – Netra Pathak & Kush Tekriwal

Originally posted on April 25, 2020 at https://fanfictiondatascience.tumblr.com/post/616410483256328192/a-prototype-review-visualization-tool-for-the.

Authors: Netra Pathak and Kush Tekriwal

Hey there! We’re back, the researchers studying the fanfiction community at the University of Washington’s Human-Centered Data Science Lab. This time around, we’ve created a prototype feedback tool that we hope will be helpful to the fanfiction community. The tool will contain dashboards with concise summary reports and trends of an author’s reviews that may help the author reflect on their writing. We have a personal motivation to enhance the joy of writing, and are interested in hearing what authors think of our prototype tool.

image

Introducing the Concept

We’ve found the fanfiction community provides just the right kind of encouragement with its self-sustaining, distributed-mentoring setting. (Distributed mentoring differs from standard mentoring because it’s shared in small pieces by a large number of people.) This environment improves the writing of many authors but also boosts self-confidence. Hence, we thought that gathering review summaries and offering a reflection tool of all feedback received might be useful. This might help to further improve writing proficiency.

In this part of our study, the overarching research question we have is: “How can visualizations help fanfiction authors further enhance their learning from reviews?”

We’re interested in your feedback on this prototype visualization tool.

Our hypothesis is that providing an author with a holistic overview of all their reviews, customizable to the story or chapter level, may help the author glance over their work and synthesize areas of improvement. We believe learning from the feedback given in a distributed-mentoring community is important, and the technique of visual analytics (interactive visualizations combined with computation and analytical reasoning) can enable authors to recognize their strengths and weaknesses as writers. In addition, these reports may help authors understand why some chapters are received better than others and whether they have any other correlating factors such as time or other factors.

The tool could be extended to the fandom level, so authors could follow other author trends based on common fandoms, etc.

Background Information and Context of Data

We leveraged a dataset collected by the UW Human-Centered Data Science Lab that contains more than 176 million reviews from Fanfiction.net [2]. For our prototype analysis, we only used a subset of the data of authors and their stories and reviews.

For the purpose of analysis, we have machine-classified reviews into a few categories. The review classifications are generated by ALOE (Affect Labeler of Expressions), an open-source tool developed to train and test machine learning classifiers to automatically label chat messages with different emotions or affect categories [3].

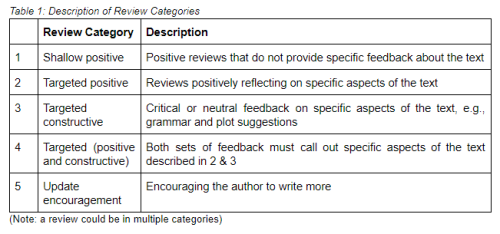
In regard to this blog post, a review can fall into one or more of the 5 categories. Table 1 below provides a description for each of the 5 categories [1] and Table 2 provides sample reviews for each of the 5 categories.

image
image

Review Trend Dashboards in the Tool

Below are the screenshots of some of the dashboard screens in the feedback tool. Through these dashboards, we hope each author can explore the story of their journey in the fanfiction community. Please be informed that as the data is sensitive, we have anonymized our results.

Differential privacy techniques have been used and the number of reviews in all figures do not represent any individual author’s actual count. Also, in Fig 4 and subsequent figures, the story ID and/or author ID do not represent the actual ID on fanfiction.net.

The first three screenshots focus on review types and trends of an individual author over time. We thought it would be interesting for authors to see the trends of the types of reviews they have been receiving over the entire year or on a weekly/monthly basis. This can enable them to analyze their peaks and dips, relate them to any external events, etc.

image

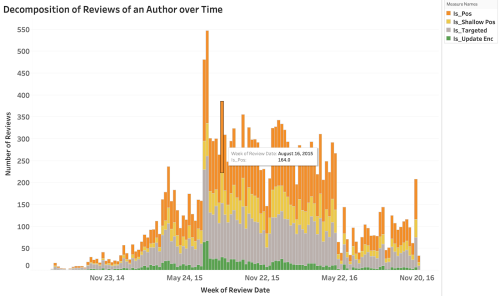
Fig 1: Overall review trend for one particular story of an author based on different review types over a time period of one year. (The trend can also be seen for all stories together, where the number of reviews equals the sum of all reviews of all stories.) Hovering over a data point gives the details in a tooltip.

In Fig 2, Fig 3 and Fig 6, stacked bar charts are used to show a larger category divided into smaller categories and what the relationship of each part has on the total amount. For example, different review categories as part of reviews received over a month (i.e. a larger category). In that case, each bar represents a whole (all reviews received in a month/week), and segments in the bar represent different parts (review categories) of that whole. Hovering over a segment of the bar chart highlights details specific to the segment.

image

Fig 2: Review type breakdown of all the stories of a particular author over time (weekly). Time can be customized to be at a weekly, monthly or yearly level. Please note, the review categories here are not mutually exclusive which results in an increased number of reviews for a few types.

image

Fig 3: Review type breakdown of the stories of a particular author over time, with the review categories being mutually exclusive. Time can be customized to be at a weekly, monthly or yearly level. 

Now, combining the above screens in one dashboard, we can either see the review breakdown and its trend for all stories together or for each story differently. For each story, we can also see the estimated chapter published dates and link them to the review dates. Hence, this way the dashboard is customizable to reflect either all stories or at story/chapter level.

image
image

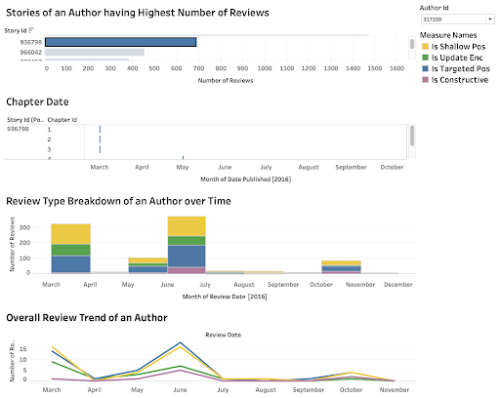
Fig 4: The dashboard contains the review breakdown in multiple categories, as well as the estimated chapter published date for a single story of an author. The above results are for a particular author ID 317330 (all IDs are anonymized) for a single story ID 936798 (blue highlighted) and similarly, we can see for each of the individual story IDs or for all stories together (see Fig 5 below). 

image

Fig 5: The dashboard contains the review breakdown in multiple categories, as well as the estimated chapter published date for stories of an author. These stories are ordered by the number of reviews received by that particular story of the author. Here, it may be assumed that the stories that have received the highest number of reviews are the popular stories for the author.

The final dashboard below enables authors to see at a glance the number of reviews of each of their stories, while also being able to juxtapose their stories. Every author will have stories that receive more reviews and ones that receive fewer, and these dashboards may give them the ability to learn which story characteristics may lead to a greater number of reviews.

image

Fig 6: The dashboard gives informative review details for all the stories of an author. We can see the number of reviews received monthly and the review categories breakdown for each story of an author. This dashboard potentially gives the ability to analyze which stories were a success and received a lot of update encouragement and positive feedback, while on the other hand, which stories received critical acclaim, constructive feedback, etc.

Does Analysis Matter?

There is an obvious question in mind while seeing these visualizations and data trends: How does the analysis help? How is this reflection beneficial? Just like how customer feedback is crucial for future product development and improvement, no matter the size of the organization; similarly it doesn’t matter if I am an author starting out, a well-versed author mid-way in my writing experience, or a proficient author. Analysis provides a better view of what needs to be changed or improved, if any, whether you are an individual, or represent a group, business or company. Such information can be used to make informed decisions. For example, in the context of fanfiction, for a starter it may be useful to know what kind of stories are read and reviewed more and why, what kind of plots are acknowledged more, etc. For an author who has written multiple stories, it may be useful to know which stories received maximum appreciation to continue using similar components and keep up his/her fanbase.

However, all said and done, these are just our speculations! We want to know what you think! We want to know from you if such analysis is helpful to the fanfiction authors, or if you would like some changes. We would love to pivot in the direction that is most useful for you.

That’s a Wrap

As we deliver this system of dashboards, we hope to create a positive impact by highlighting the trends and summary reports of review types for the stories of an author. For example, new authors in the community may be able to observe trends such as an increasing number of update encouragement reviews and in turn might feel encouraged to write more. :D

The tool and the dashboards are a medium to see feedback from other authors and readers over time.

We will also be encouraged if we get feedback from you. Please share your thoughts and comments so we can learn about your likings as well! To validate our research, we would also love to work with members in the fanfiction community and know whether our solution is effective or not. We would like to extend this work based on the responses we receive.

This is it for now! In the coming months we will develop more dashboards and post them as there are a plethora of questions we can ask this data. Heartfelt thanks for taking a look at our prototype. If you have any questions or want clarification on any of the data, please don’t hesitate to reply to this post, reblog with a comment, or send an ask. We’ll be happy to clear up any confusion the best we can!

Acknowledgments

We would like to express our deepest gratitude towards Prof. Cecilia Aragon and Jenna Frens at the Human-Centered Data Science Lab for their useful critiques, ideas, constant guidance and enthusiastic encouragement of this research study. It was an honor to work with them.

Additional Information

Earlier research in our group, published in the paper ‘More Than Peer Production: Fanfiction Communities as Sites of Distributed Mentoring’ has outlined 13 categories that were observed in Fanfiction.net reviews [1]. 

1. Evans, S., Davis, K., Evans, A., Campbell, J. A., Randall, D. P., Yin, K., & Aragon, C. (2017, February). More than peer production: fanfiction communities as sites of distributed mentoring. In Proceedings of the 2017 ACM Conference on Computer Supported Cooperative Work and Social Computing(pp. 259-272). ACM.

2. Aragon C. Human-Centered Data Science Lab » Distributed Mentoring in Fanfiction Communities. https://depts.washington.edu/hdsl/research/distributed-mentoring/. Published 2019. Accessed June 5, 2019.

3. Brooks M. etcgroup/aloe. GitHub. https://github.com/etcgroup/aloe

4. University of Washington, Human-Centered Data Science Lab » Research »Distributed Mentoring in Fanfiction Communities. https://depts.washington.edu/hdsl/research/distributed-mentoring/

Tags:

Fanfiction Community Survey Part 1: Overview of Results – Ruby Davis

Posted by Human-Centered Data Science Lab on June 10, 2021
Fanfiction Data Science, Human-Centered Data Science Lab (HDSL) Blog / Comments Off on Fanfiction Community Survey Part 1: Overview of Results – Ruby Davis

Originally posted on January 6, 2019 at https://fanfictiondatascience.tumblr.com/post/181788901675/hi-im-ruby-and-im-part-of-a-group-of.

Hi! I’m Ruby, and I’m part of a group of researchers studying fanfiction communities through the University of Washington’s Human Centered Data Science Lab.
In November of 2017, we sent out a survey to all of you to learn a bit more about what...

Hi! I’m Ruby, and I’m part of a group of researchers studying fanfiction communities through the University of Washington’s Human Centered Data Science Lab.

In November of 2017, we sent out a survey to all of you to learn a bit more about what motivates folks to participate in fanfiction communities, what kinds of activities you all participate in, and where your communities are. It’s been a hot minute, but I finally have some results to share!

We were absolutely blown away by your enthusiasm filling out our survey. We got a total of 1,888 responses from all over the world, which was way more than we ever could have imagined. Thank you all so much!

In this blog post, I’ll give a quick overview of participant demographics and fan experience data. Then I’ll finish off with a preview of a few more blog posts to come!

Demographics

Survey participants’ demographic information matched well with previous fanfiction community censuses. (1234) If you’re familiar with fandom spaces, this section shouldn’t be too much of a surprise.

Gender

The following chart represents the gender distribution of our participants. These percentages are not cumulative! Participants could check as many identities as applied to them.

image

Gender identities that fall under the nonbinary and genderqueer umbrellas were aggregated for the purpose of this chart, but a comprehensive distribution will be shared in a more robust demographics post later on. Stay tuned!

Age

The age distribution of participant was pretty typical of fanfiction communities. This chart expresses the distribution as percentages. Children under 13 were excluded from filling out the survey.

image

Location

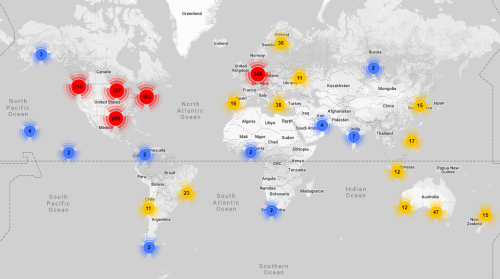
We collected some general location data and found that most of our participants were from the United States and Europe. That said, participants answered our survey from all over the globe. Here’s a map of where our participants were from.

image

(Please click for full-size!)

This map was created by aggregating coordinate data into different “buckets” based off of how close those locations were to one another. Each of the colored circles on the map represents one of these “buckets”. Any coordinate within a certain distance from the epicenter of each circle is included in the total displayed at the center of that circle.

To put that in context, the red circle over Germany doesn’t mean that there are 349 participants from Germany—it means that there are 349 participants from various locations around Europe, with the center of that bucket being located in Germany.

Blue circles represent buckets of 10 or fewer participants, yellow circles represent buckets of 100 or fewer participants, and red circles represent buckets of more than 100 participants.

Fandoms

Participants represented a great spread of different fandoms. Keep in mind that these results are from November 2017 through January 2018, so the fandoms represented in this word cloud are the ones that were popular among participants a year ago.

image

This word cloud only includes fandoms that were listed by ten or more participants. Although we did combine synonyms of fandom names (e.g. BNHA, My Hero Academia, MHA, etc. are synonyms of Boku no Hero Academia) we did not do any “meta-categorizing” (e.g. making Boku no Hero Academia a synonym of “Anime”). Therefore, the only fandoms included here are ones that were listed explicitly.

Fan Experiences

The biggest part of our survey delved into the activities that people in fanfiction communities participate in. We’ll give some more in-depth analysis of this data later, but for now, here’s a taste.

Personal History

First off, let’s talk about experience in terms of time. The following chart shows how long participants have been involved with online fanfiction communities.

image

Please keep in mind that each of these brackets are different sizes. The first bracket, “1 – 2 years”, represents only a 2-year span, while the fourth spans 10 years.

Which Fanfiction Communities?

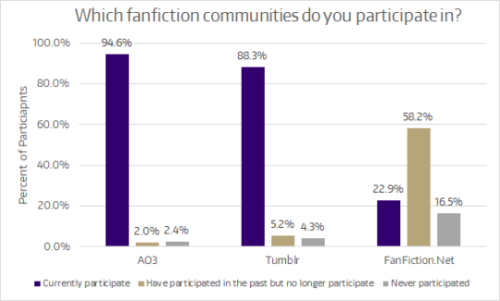
Fans who filled out our survey were mainly based on tumblr and AO3, and most had used FanFiction.Net in the past. This is good to keep in mind, because the results from fans who favor other communities—say, Wattpad—might look very different. There is no one monolithic “fanfiction community”.

image

Activities

A significant portion of our survey questions asked participants to indicate how often they do various fanfiction-related activities. Although the complete list of activities was a lot longer, for this first overview post we’re just going to focus on three: reading fanfiction, writing fanfiction, and commenting on fanfiction.

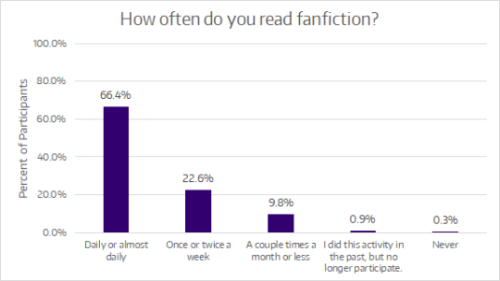
Unsurprisingly, reading fanfiction was the most popular activity among our participants. About two-thirds of participants read fanfiction every day. Only 5 participants (0.3%) indicated that they’d never read fanfiction.

image

As for writing fanfiction, the distribution is much more even across the five frequency options. About a third of participants write fic at least once or twice a week, while another third write fic more infrequently (a couple times a month or less). The final third had not written fic or were no longer writing fic at the time of the survey.

image

Leaving comments or reviews on fanfiction was a fairly ubiquitous activity. Nearly all participants (88.8%) reported that they do at least occasionally leave comments or reviews. Almost half of participants (46.7%) left comments at least once or twice a week.

image

What’s Next?

Now that I’ve shown you all a sample of the results from the survey, what else is there to see?

In the coming months, my research team and I will continue to post about additional findings from the survey results. Some of these posts may cover topics such as:

  • Demographics and activity information by fandom
  • Comparing age and different activities in fanfiction communities
  • Expanded demographic information, especially for gender

In addition, we have a significant amount of data from long responses to our survey question, “What motivates you to participate in fanfiction communities?” Participant responses were incredibly rich and detailed, and there’s a lot of fantastic information to draw from them.

For now, that’s a wrap! Thanks for taking a look at our results. If you have any questions or want clarification on any of the data shared here, please don’t hesitate to reply to this post, reblog with a comment, or send an ask. I’ll be happy to clear up any confusion, if I can.

May the force be with you all, 

Ruby Davis 
Human-Centered Data Science Lab 
University of Washington

Tags: ,