Digital Reference Object
Updated: 21 June 2016
Report of Sites and Software Tested with the DRO
The
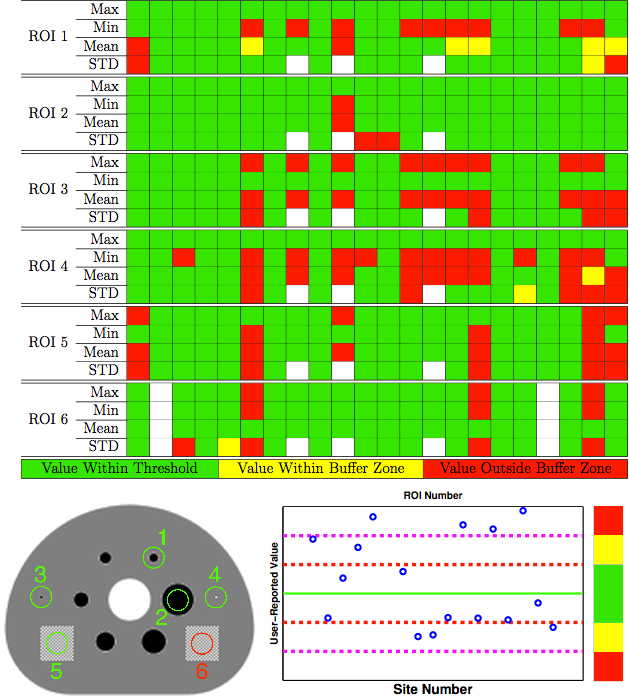
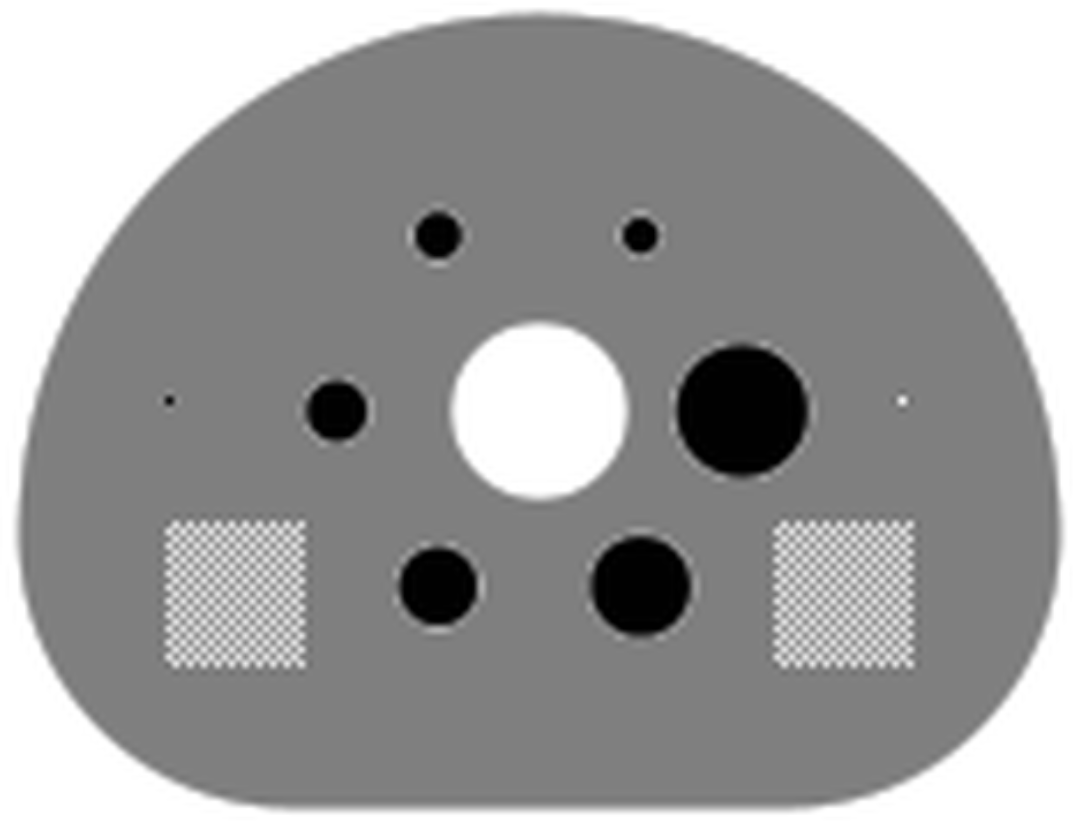
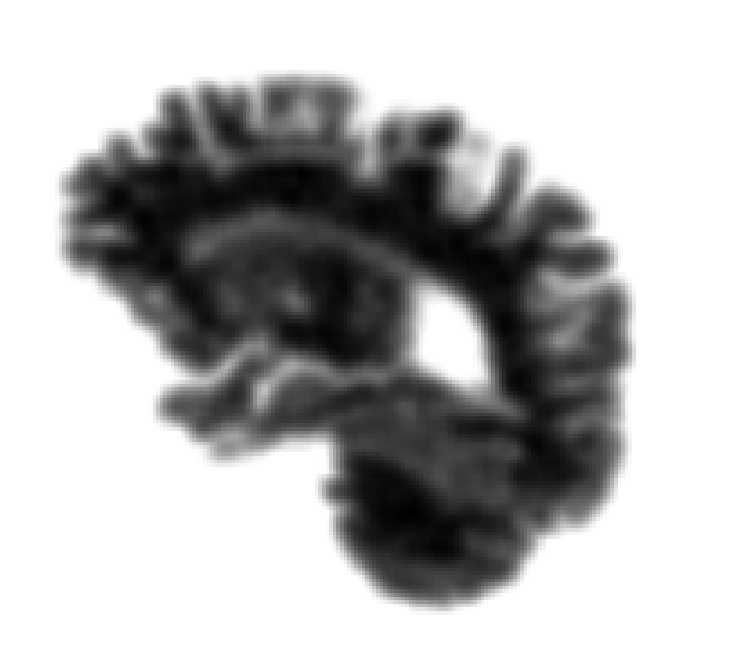
Digital Reference Object was sent to twenty-two sites for testing of software. Each user performed the ROI tests and recorded the SUV measurements taken from the six ROIs shown in the image below.
In the color-coded spreadsheet, each column represents one software test and each row is an SUV measurement taken from an ROI. A green cell indicates that the software reported an SUV value within proposed numerical bounds, yellow indicates that the reported value fell outside the proposed bounds, and red indicates that the reported value was more than 50% outside of the proposed bounds.
The full report can be downloaded
here.