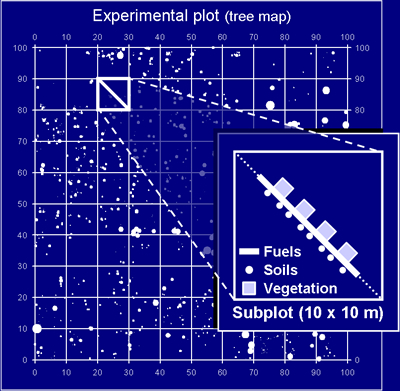
Vegetation and soils. In
each experimental plot, 32-64 subplots were sampled before (2004)
and after (2007, 2009) treatment to assess ground-surface conditions,
plant species composition, and soil physical and chemical properties
(inset diagram, below).
| Sampling
schematic |
 |
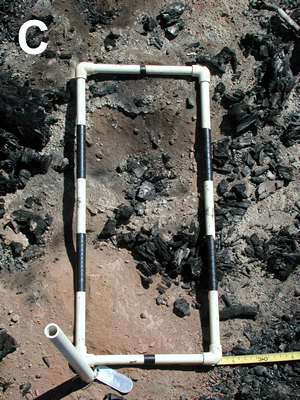
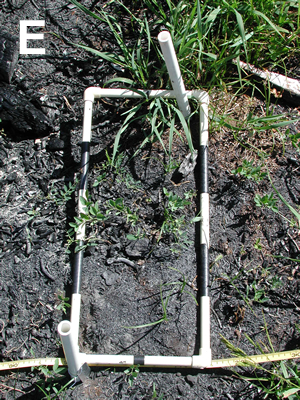
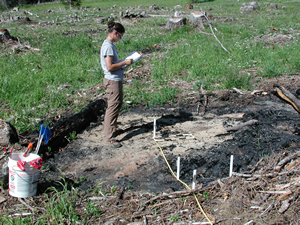
Burn-pile scars. In
the unburned treatments, 10 burn scars per plot were each sampled
at four locations—center (C), edge (E), unburned edge (U1),
unburned distant (U2)—to assess the local effects of intense
heating on vegetation and soils.
| Burn-pile
transect |
 |
| Sampling
schematic |
 |
Analyses. Statistical
analyses of the vegetation focus on changes in cover and richness
of species associated with meadow, forest, and disturbed habitats
(ruderals) (see Plant species list) and on density of conifer seedlings.
Analyses of soils focus on ground-surface conditions (exposure of
mineral soil) and soil chemistry (total C and N, total available
N, and pH).
Responses
to treatments were assessed with repeated measures ANOVA. To account
for pre-treatment variation among plots, analyses of vegetation
responses were based on differences between pre- and post-treatment
measurements. Analyses of soils and conifer seedlings were based
on post-treatment samples. |
| Sampling
subplots |
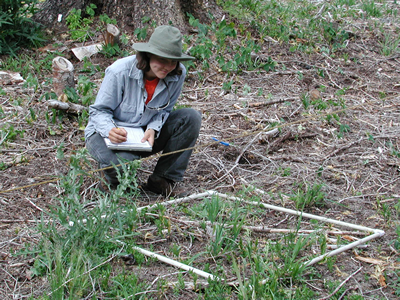 |
| Vegetation
quadrat (1 x 1 m) |
|
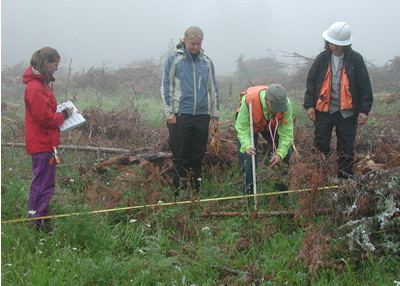 |
| Post-harvest
fuels sampling |
|
|
|