Twentieth century America witnessed a number of consequential migrations, Great Migrations, that helped reshape culture, politics, or economic structures. Here are eighteen interactive maps and charts that help us visualize some of the major migrations. Based on IPUMS-USA census samples, they were created by James Gregory, Professor of History, University of Washington, using Tableau Public.
.gif)
Click to see map and charts
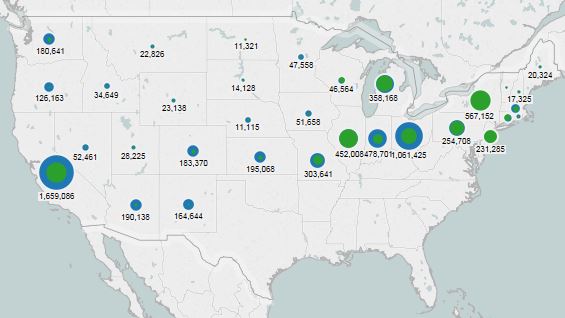
Mapping the African American Great Migration
Here are six interactive maps and charts that show the numbers of African American migrants leaving the South, the states and cities where they settled, and their states of origin for each decade 1900 to 2000. Filters allow you to select particular states, birth states, and years.

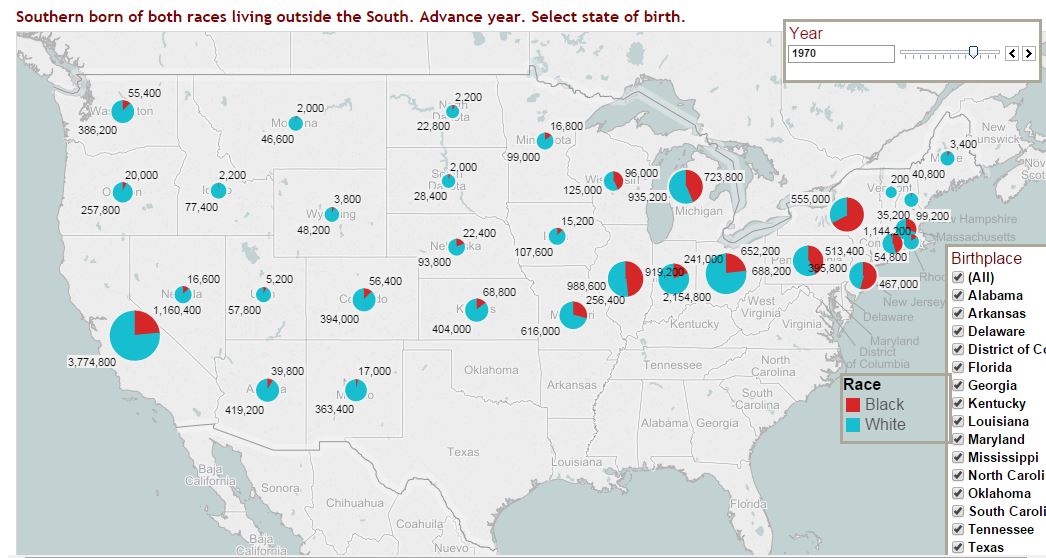
Click to see map and charts Mapping the Southern Diaspora
Six maps and charts compare the migration patterns of all southerners: Asians, Blacks, Latinos, Natives, Whites.

Click to see map and charts Big Cities and Great Migrations
Who settled in the big cities of the North and West? Three interactive maps show the answers decade by decade.

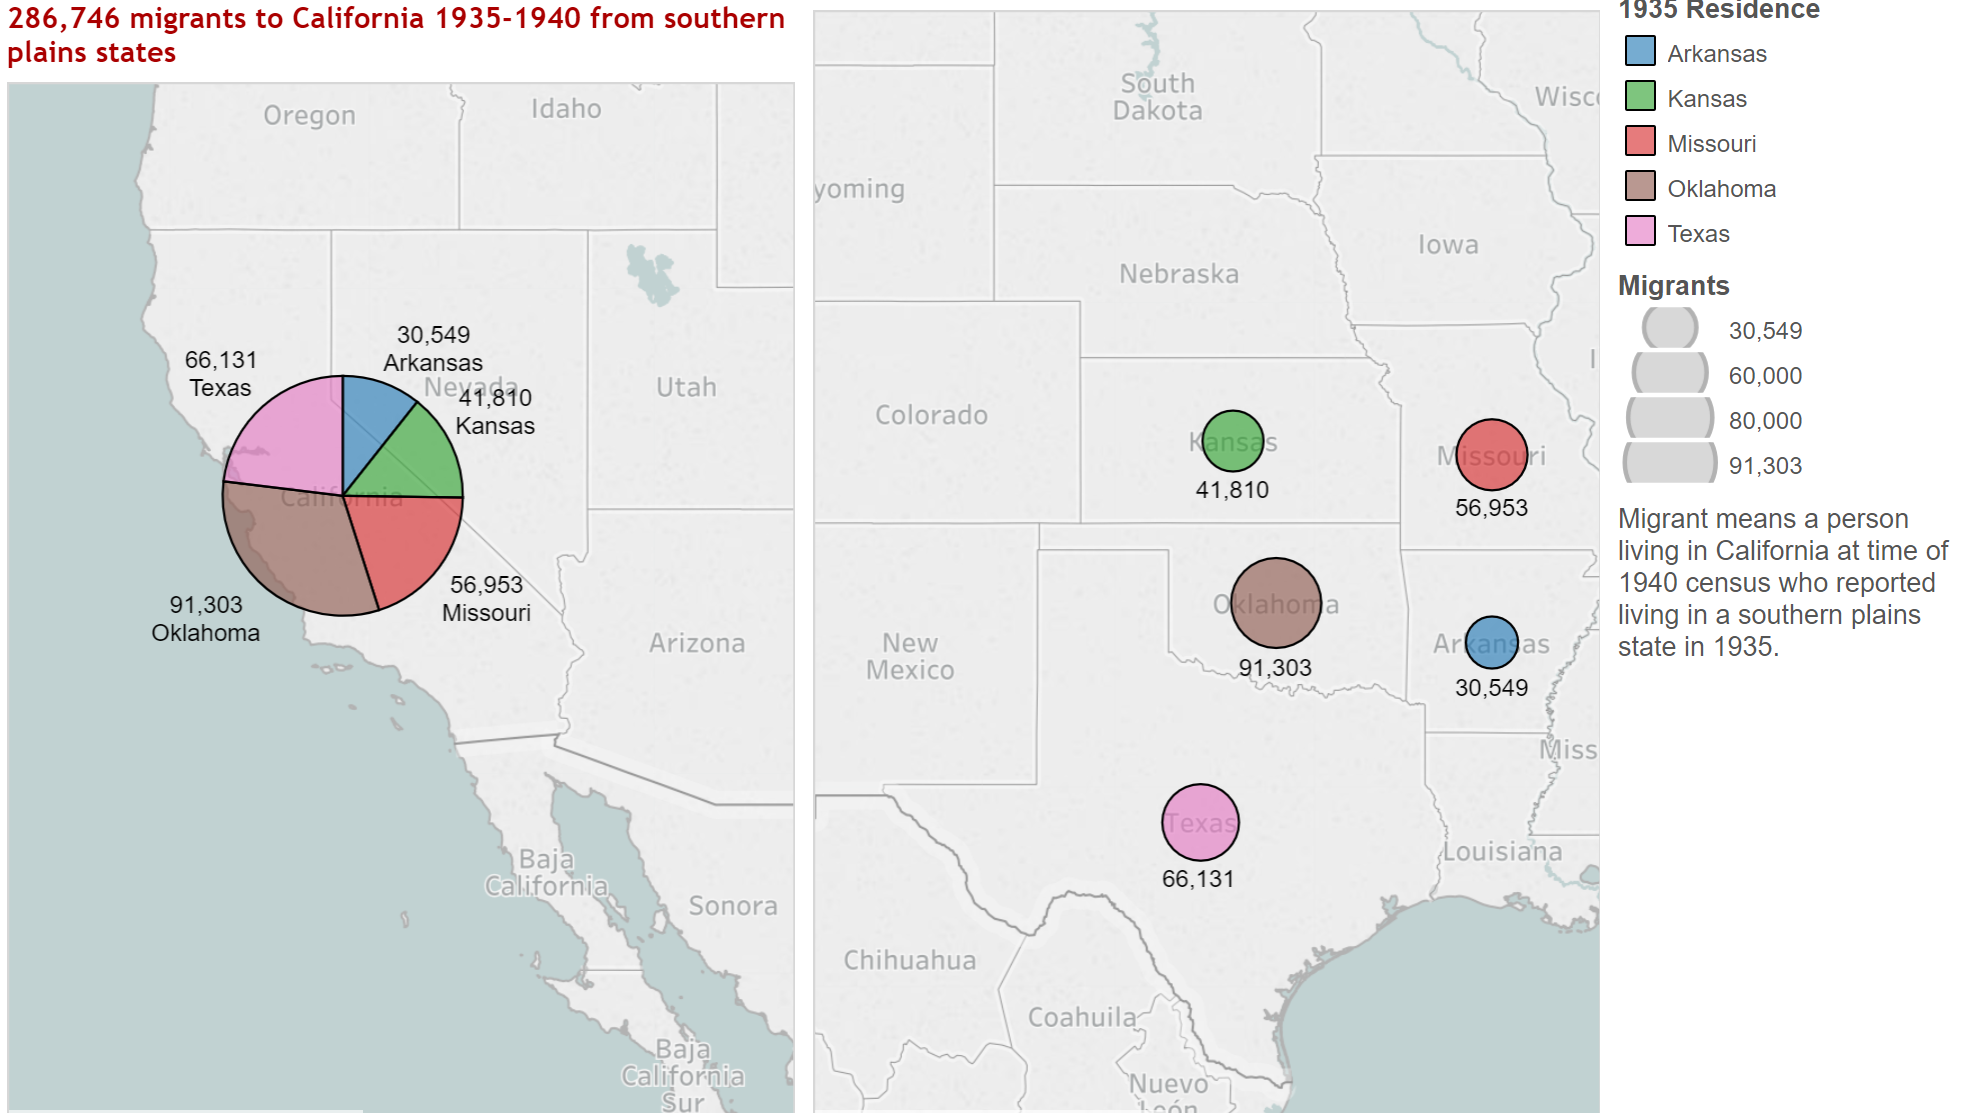
Click to see map and charts Mapping the Dust Bowl Migration
The relocation to California of close to 400,000 Oklahomans, Texans, Arkansans, and Missourians during the Great Depression was the most publicized mass migration of that decade. Three interactive maps show various dimensions of the Dust Bowl migration.
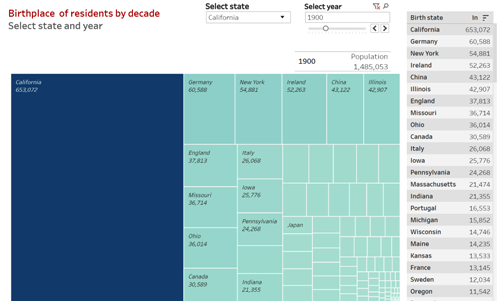
State by State Migration Histories 1850-2010

Click to see map and charts
Here are charts and tables showing who moved to each state and who left each state. Using birthplace information, we track decade-by-decade the population origins of California, Florida, Texas, Illinois, New York, Hawaii, and every other state, showing countries of birth and states of birth. Secondly, we show where people from each state settled, how many stayed and how many left.
How to cite and copyright information | About project | Contact James Gregory
Follow the Project and receive updates on Facebook Facebook