
by James Gregory
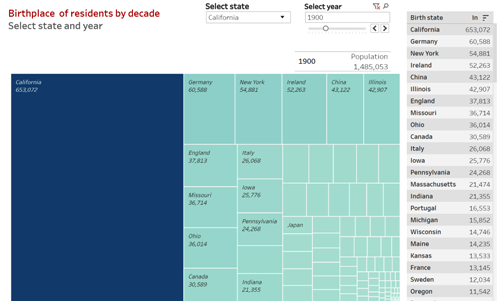
This is part 2 of the sequence on the Southern Diaspora. Start with the introductory essay "The Southern Diaspora: Black, White, Latinx, Asian, Indigenous outmigration 1900-2000." Here are interactive maps and charts that show various dimensions of the great migrations out of the South. They show decade by decade the number of southerners living in northern and western states. Select a state of origin and see where people went. Or select a state of residence and see the states of origin. Filter or compare by racial categories. The maps are hosted by Tableau Public. If slow, refresh the page.
Move between six maps and tables by selecting tabs below
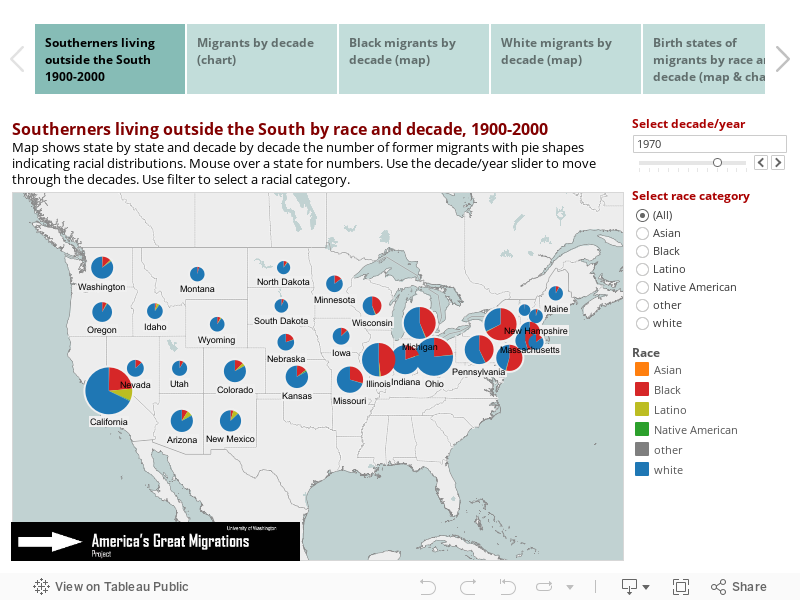
If the interactive does not load, view it on Tableau Public (opens in a new tab).
Source: These maps are based on research published in James N. Gregory, The Southern Diaspora: How the Great Migrations of Black and White Southerners Transformed America (Chapel Hill: University of North Carolina Press, 2005). The U.S. Census data is from the Minnesota Population Center's IPUMS USA: Steven Ruggles, Katie Genadek, Ronald Goeken, Josiah Grover, and Matthew Sobek. Integrated Public Use Microdata Series: Version 6.0 [Machine-readable database]. Minneapolis: University of Minnesota, 2015, the following samples: 1900 1%, 1910 1%, 1920 1%, 1930 1%, 1940 1%, 1950 1%, 1960 1%, 1970 1% Metro FM1, 1980 1% Metro, 1990 1%, 2000 1%.
Maps and calculations: James Gregory.
Additional maps and charts
Click to see map and charts
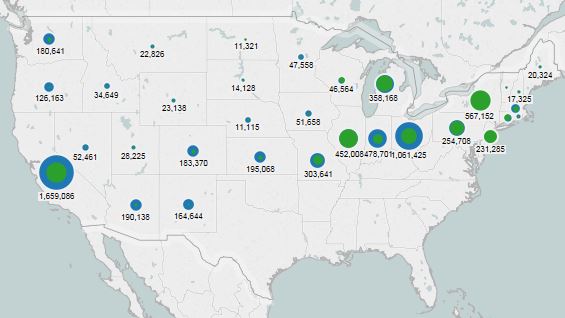
Big Cities and Great Migrations
An estimated 28 million Black, White, Latino, Asian, and Native American southerners left the region in the 20th century, joining in the great migrations we call the Southern Diaspora. Many, especially Black migrants, settled in the big cities of the North and West. This page accompanies the main pages of the Southern Diaspora section. These interactive maps and charts show decade by decade the number of southerners living in northern and western metropolitan areas (central cities and surrounding country). Filter by racial categories.
Click to see map and charts
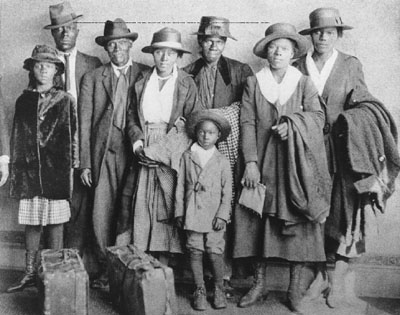
African American Great Migration
Upwards of 7 million African Americans left the South during the 20th century, settling mostly in the big cities of the North and West. In doing so they transformed more than their own lives. This Great Migration transformed cities and set the foundations for reconstructions of race, politics, and even the regional balances of the nation. This section includes six interactive maps and charts.
Click to see map and charts
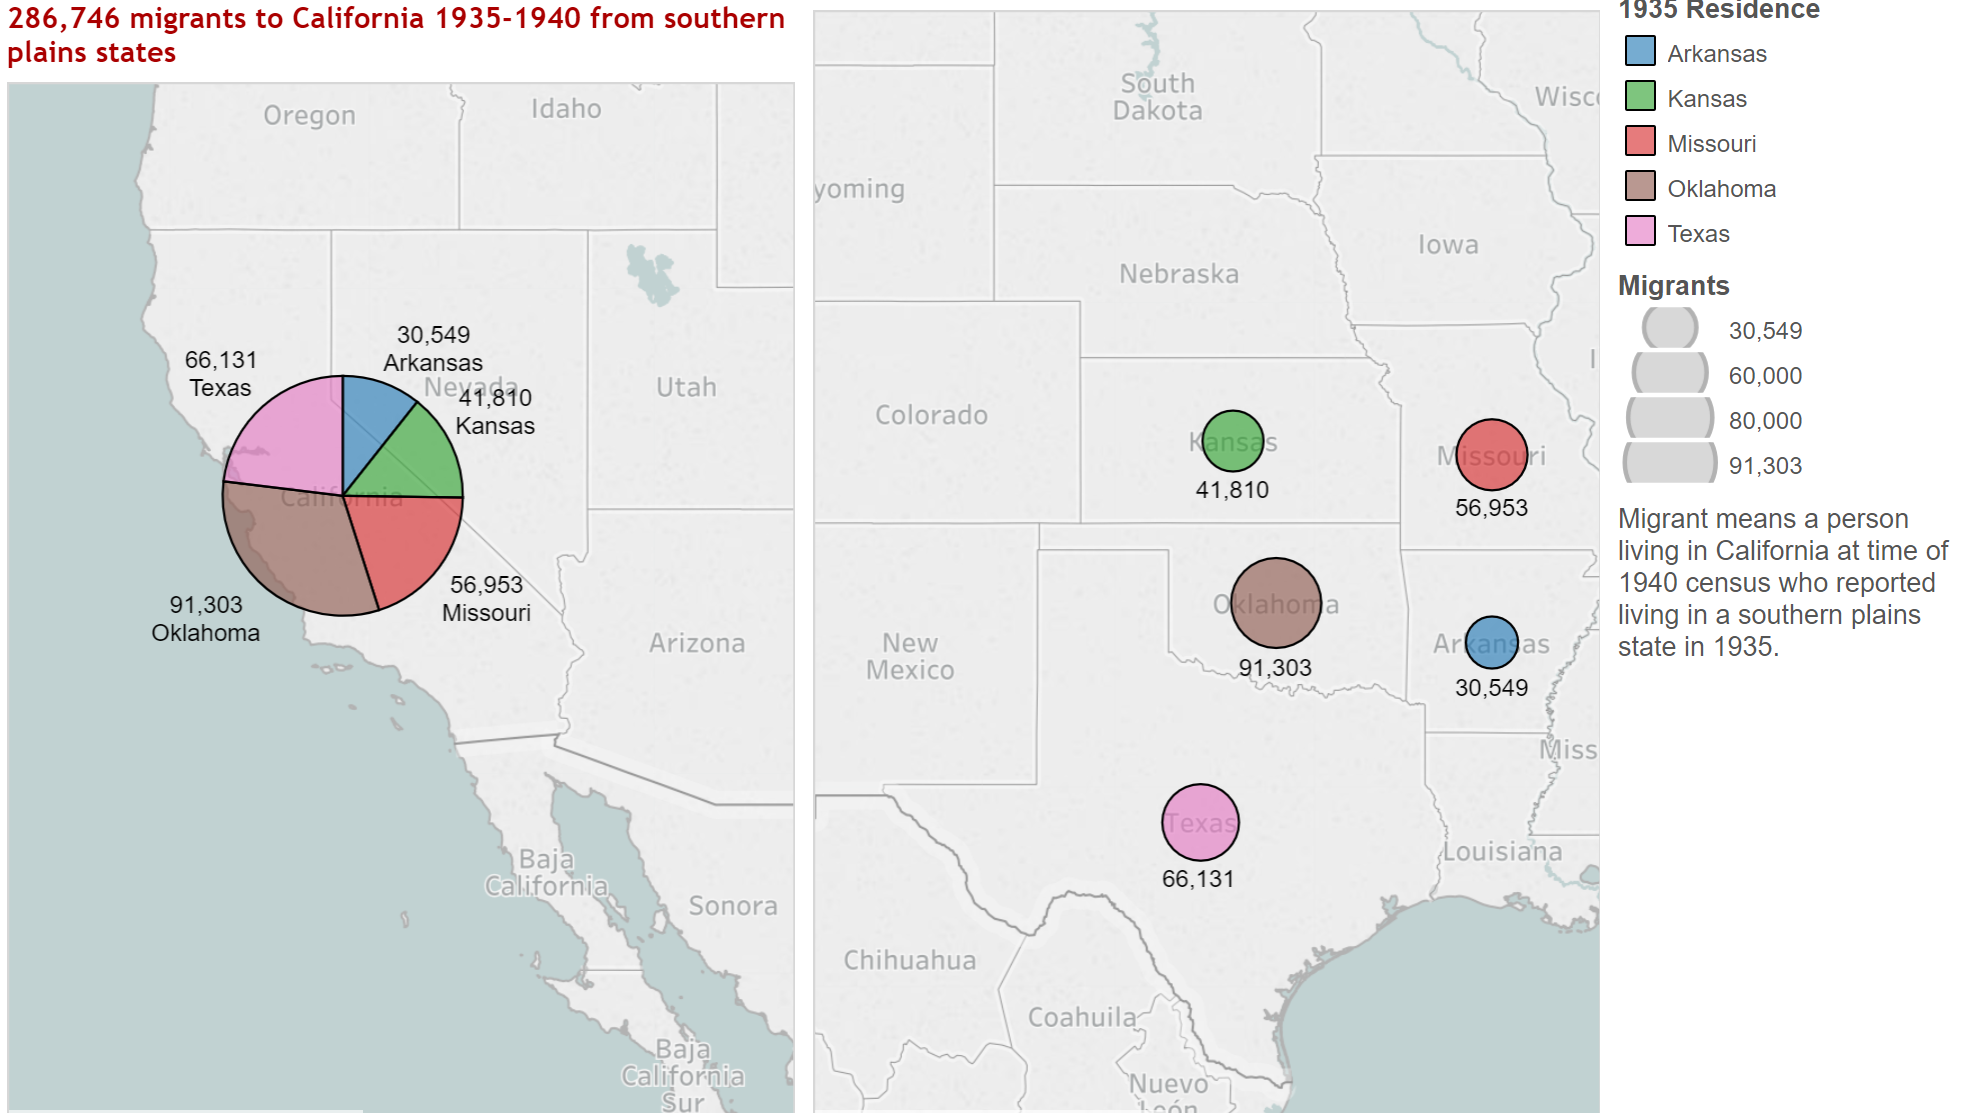
Mapping the Dust Bowl Migration
The relocation to California of close to 400,000 Oklahomans, Texans, Arkansans, and Missourians during the Great Depression was the most publicized mass migration of that decade. Three interactive maps show various dimensions of the Dust Bowl migration.
State by State Migration Histories 1850-2010
Here are charts and tables showing who moved to each state and who left each state. Using birthplace information, we track decade-by-decade the population origins of California, Florida, Texas, Illinois, New York, Hawaii, and every other state, showing countries of birth and states of birth. Secondly, we show where people from each state settled, how many stayed and how many left.