
 click to go to maps and charts
by James Gregory
When did Asians first come to America? Tens of thousands of years ago across the Bering land bridge. And much later in the 16th century when Filipinos joined Spanish crews crossing the Pacific and exploring North America. Hawaiians, Chinese, and Filipinos later crewed the American and European ships crisscrossing the Pacific in the decades before the United States seized what would become California, Oregon, Washington, and the American southwest. The California gold rush that began in 1848 brought more, especially Chinese people from the Guangdong region. The US census of 1860 counted more than 34,000 Chinese living in California and small numbers in a few other states. Migration continued briefly but Chinese immigration was brought to a brutal halt when Congress passed the Chinese Exclusion Act (1882) which was followed by murderous "driving out" campaigns which saw deadly violence by white mobs in towns and cities across the West. A population that had grown to 119,000 fell into a long demographic decline. In 1940, only 72,000 persons of Chinese ancestry remained in the United States. This was the first example of the cycles of persecution and expulsion that Asian peoples would face.
This page introduces the history of Asian and Pacific Islanders migration to the United States and between states - a sequence of consequential migrations that have transformed the US. This introductory page leads to a set of interactive maps, charts, and tables found on the Mapping Asian American and Pacific Islander Migrations page. Those visualizations allow us to separately track the migration history of people from many nations in Asia and the Pacific. We also highlight the importance of internal migration by showing state of birth and state of residence for the millions of American born persons of Asian heritage. GO TO MAPPING PAGE
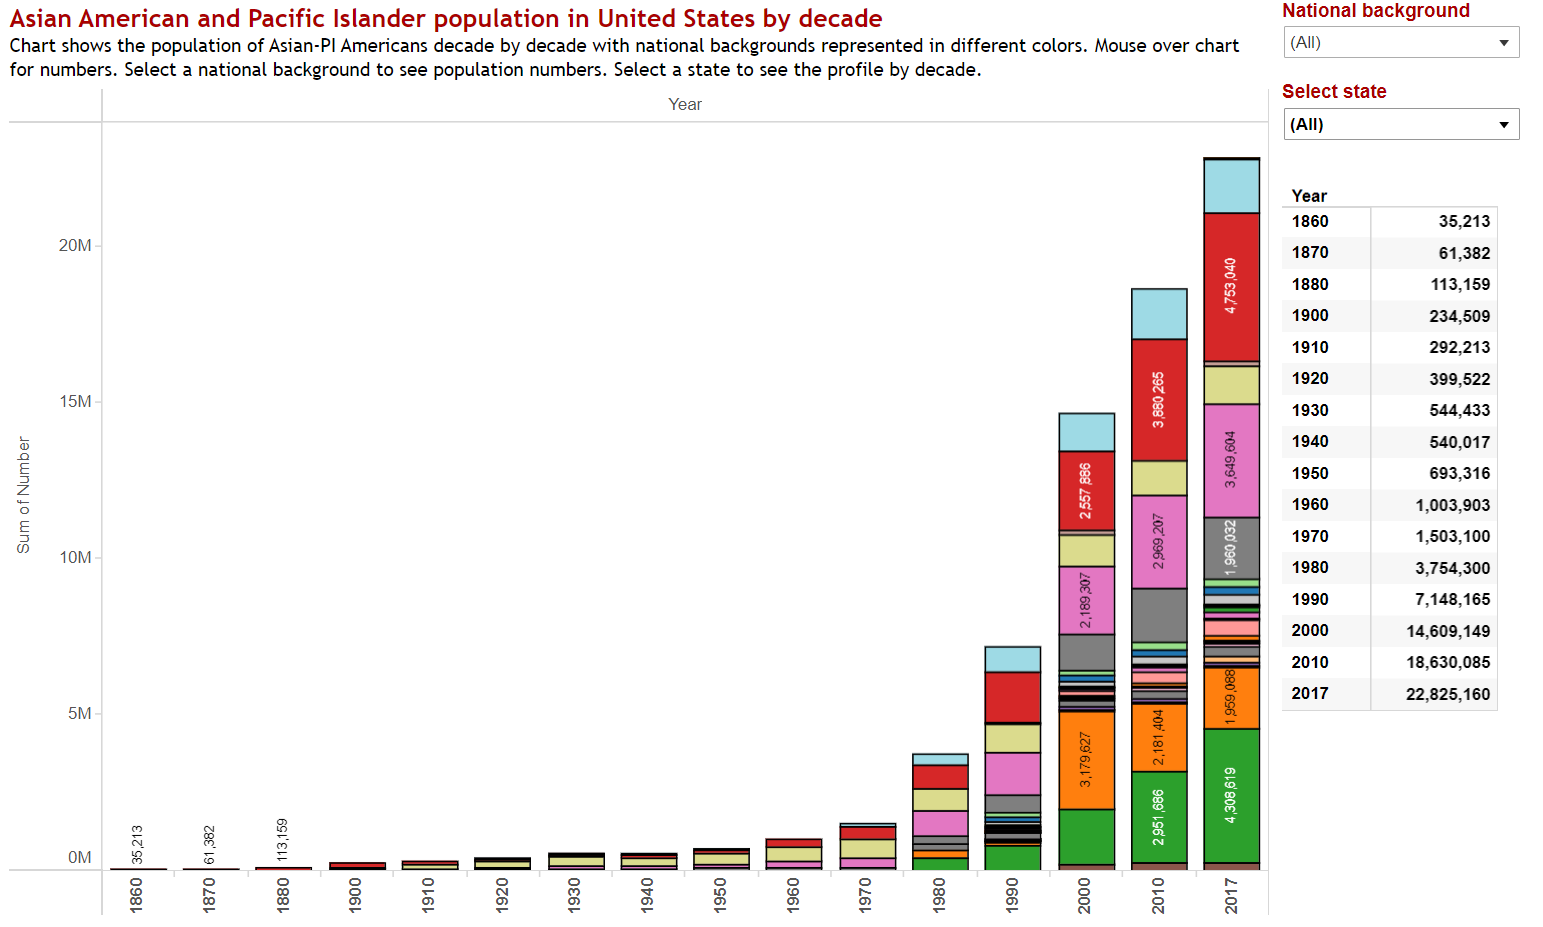
Decade by decade populations by national background. Click to explore.
1890-1930
In the decades before and after the turn of the 20th century as Chinese exclusion took effect and as the US seized colonies in the Pacific, Japanese people in substantial numbers along with smaller contingents of Okinawans, Koreans, and South Asians crossed the Pacific. Hawaii and California were the primary destinations with farming or farm work the principal attractions. Anti-Asian hatred soon refocused on the newcomers in the same government-private combination that been used against Chinese people. Federal action squeezed off new immigration while nativist campaigns in western states yielded Alien Land laws and other measures designed to limit economic opportunities.
The 1920 census reported just under 400,000 Asian-ancestored Americans, with Japanese the largest at 225,000 followed by 88,000 Chinese, many of them elderly men marooned in shrinking Chinese American communities. That year, Congress passed the first of two draconian immigration laws that banned all immigration from Asia while imposing nearly as strict limits on immigration from Eastern and Southern Europe. The restrictions did not apply to Filipinos, Guamanians, and others who lived in US colonies. To the consternation of West Coast xenophobes, Filipinos, some of them educated in colonial schools, headed for Hawaii, California, Washington, and Oregon. The 1930 Census counted just under 100,000 Filipinos living in the US. Most were engaged in farm and cannery work, including those who had hoped to earn college degrees. That population number, like nearly all of the tabulations of Asian Americans, was an undercount. Mobile lifestyles, remote rural settings, and the sensible wariness by people who had every reason to seek invisibility mean that we need to regard the census numbers shown on the accompanying maps and charts as low estimates.
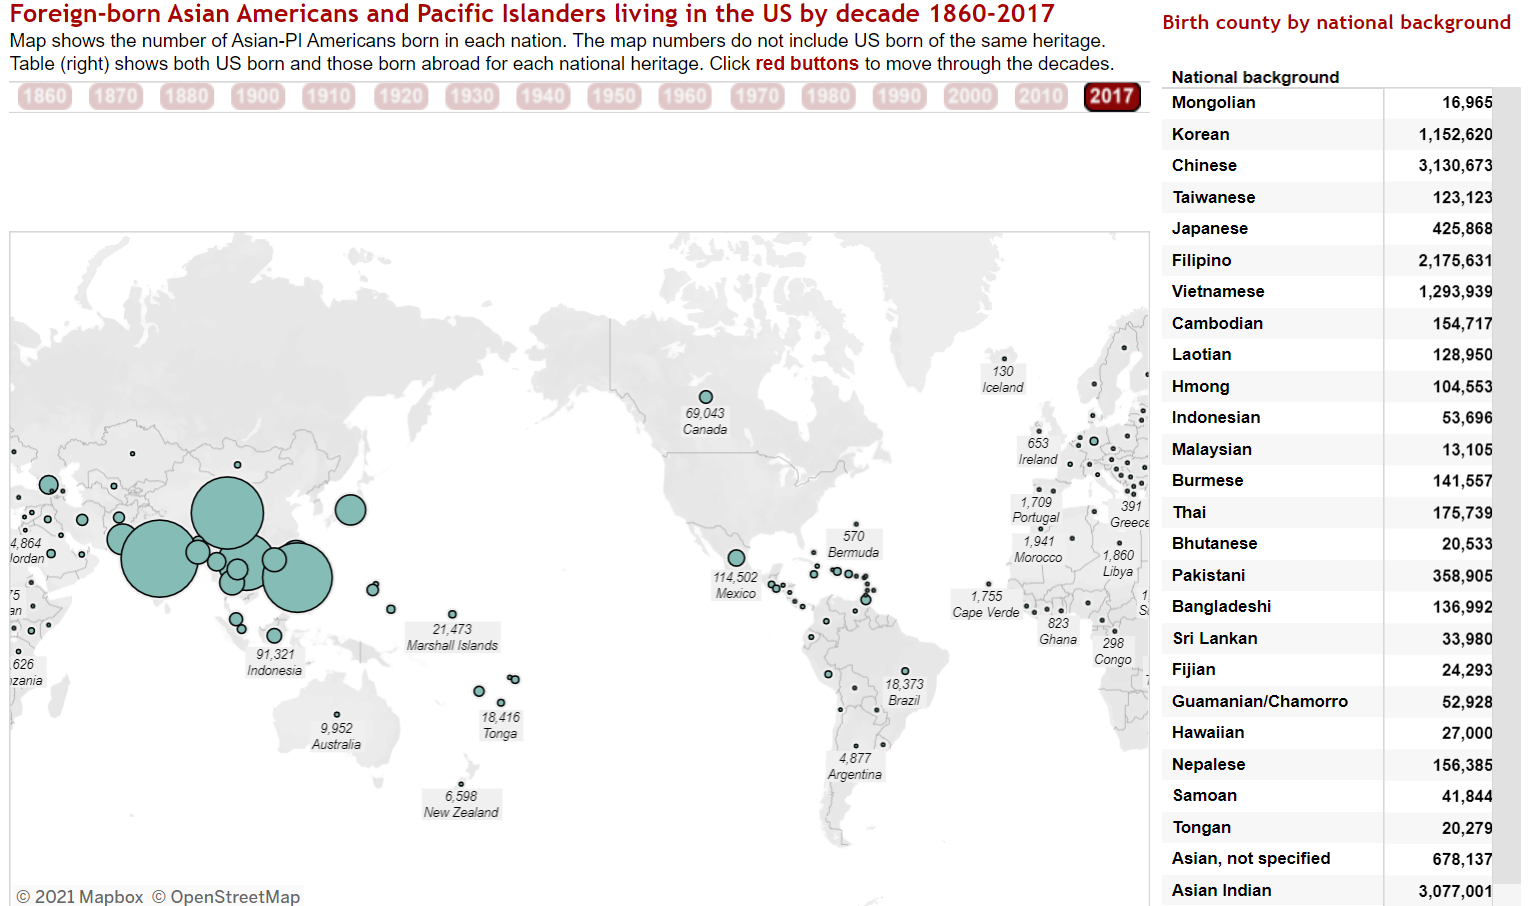
Country of origin for foreign-born Asian Americans by decade. Click to explore.
1930-1945
The 1930s and 1940s witnessed the most brutal anti-Asian episodes since the driving out campaigns of the 1880s. The Great Depression fed xenophobia and Filipinos became one of the key targets, subjected to official and unofficial persecution/expulsion programs. Passed in 1934, the Tydings-McDuffie Act changed the status of the Philippines and of Filipino Americans. The Islands were promised eventual independence (not realized until 1946) while Filipinos were declared noncitizens of the United States subject to a near total immigration ban. The Filipino Repatriation Act passed in 1935 was intended to encourage/require those already in the US to leave. It worked to some extent: the 1940 census recorded a drop in Filipino population living stateside. It also records a small drop in the number of Japanese Americans and an overall dip in the population of Asian Americans.
Japanese Americans had faced persecution derived from Depression-era economic tensions, but antagonism also grew as the Empire of Japan and the empire of the United States faced off in the Pacific after 1937. When the Japanese navy attacked Pearl Harbor in December 1941, the United States declared war not merely on the nation of Japan but also against Japanese Americans. In early 1942, more than 120,000 persons of Japanese ancestry, many of them US-born citizens, were forced from their homes in West Coast states and locked in hastily constructed but heavily guarded concentration camps hundreds of miles into the interior. When the war ended and internees were released, some had little reason to return to California, Oregon, and Washington. The Japanese American population had begun a dispersion across the United States that can be traced on the accompanying maps.
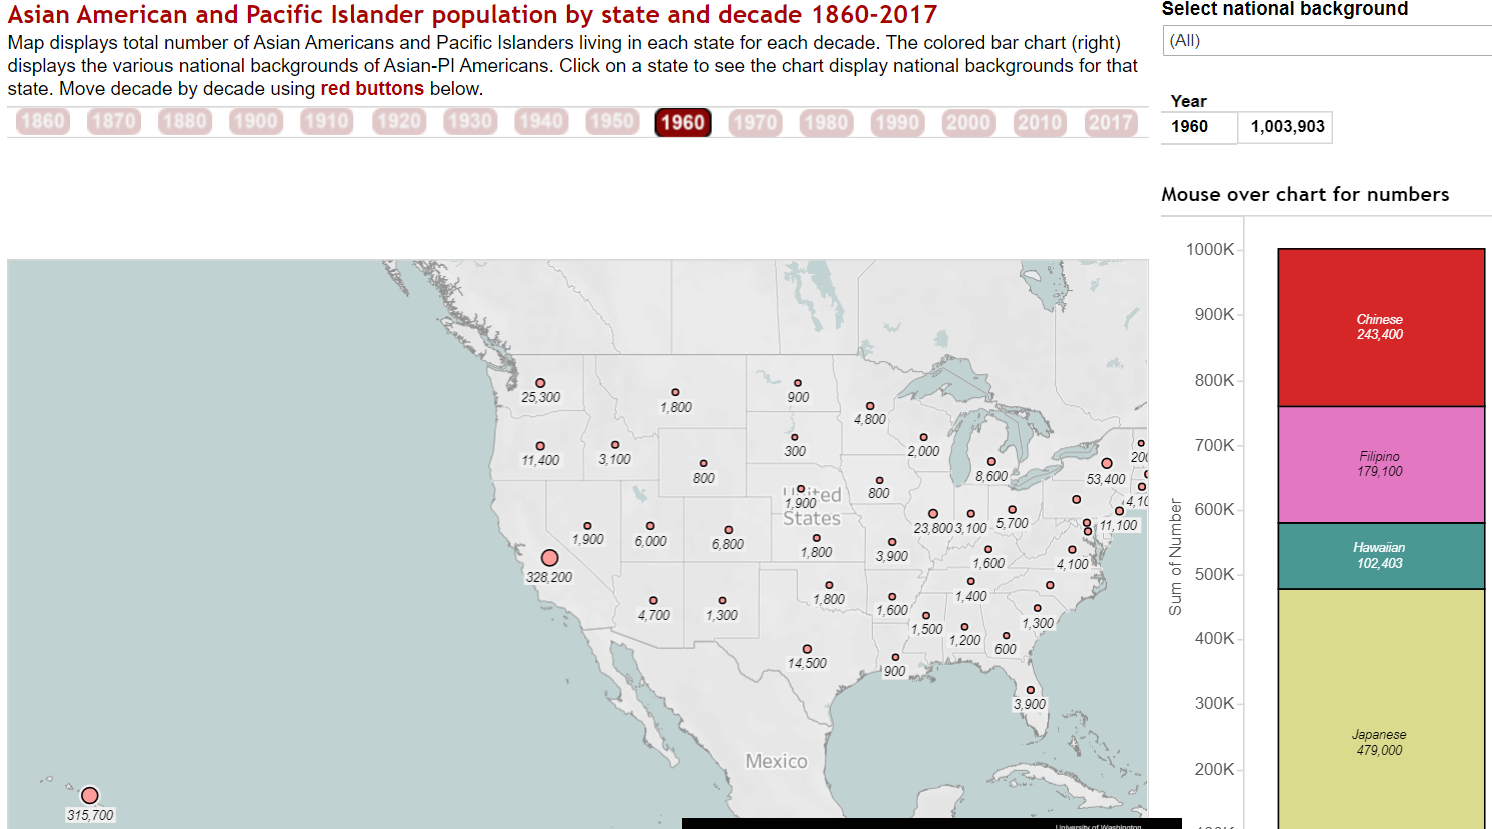
Populations increased modestly after World War II. Map shows 1960 numbers. Click to explore.
1945-1965
World War II created new allies for the United States. China, which had faced the most devastating attacks by the Empire of Japan (losing at least 5 million dead), played a key role in US military and diplomatic calculations. Rethinking the vicious policy of earlier decades, Congress in 1942 repealed the Chinese Exclusion Act, allowing small numbers of Chinese refugees to enter the US during the war and more after 1948 when Communist Party armies drove Nationalist Party forces from the mainland. The Chinese American population finally began to grow, reaching 243,000 in 1960. Filipinos, their islands also invaded by Japan, fought alongside US troops (and in US units) throughout WWII. Promised earlier, in 1946, the US ended its colonial presence and the Philippines became an independent nation. Small adjustments in US immigration policy allowed some Filipinos, mostly wives of US troops and select veterans and college students, to come to the US. The Filipino population in the US which had fallen to 89,000 in 1940 had begun to grow. In 1960, the Census Bureau recorded a population of 179,000.
These episodes mark the start of the modest reopening of immigration from Asia. Wars and diplomacy had much to do with this. In the decades that followed combat with Japan, the US would fight a big war in Korea, a big war in Vietnam, Cambodia, and Laos, and fight shadow wars with Communist insurgencies throughout Asia. Immigrants from these conflict regions followed, initially mostly "war brides," later under official refugee programs.
The practice started in Japan, which was fully occupied after the 1945 surrender and hosted US military bases for many decades after. Koreans followed after their pennisula endured a three year war and millions of casualities. Wives of US soldiers, college students, and adoptable infants gained permission to come to the US in modest numbers in the 1950s and 1960s adding to a previously hidden Korean American population that census takers usually counted as Japanese.
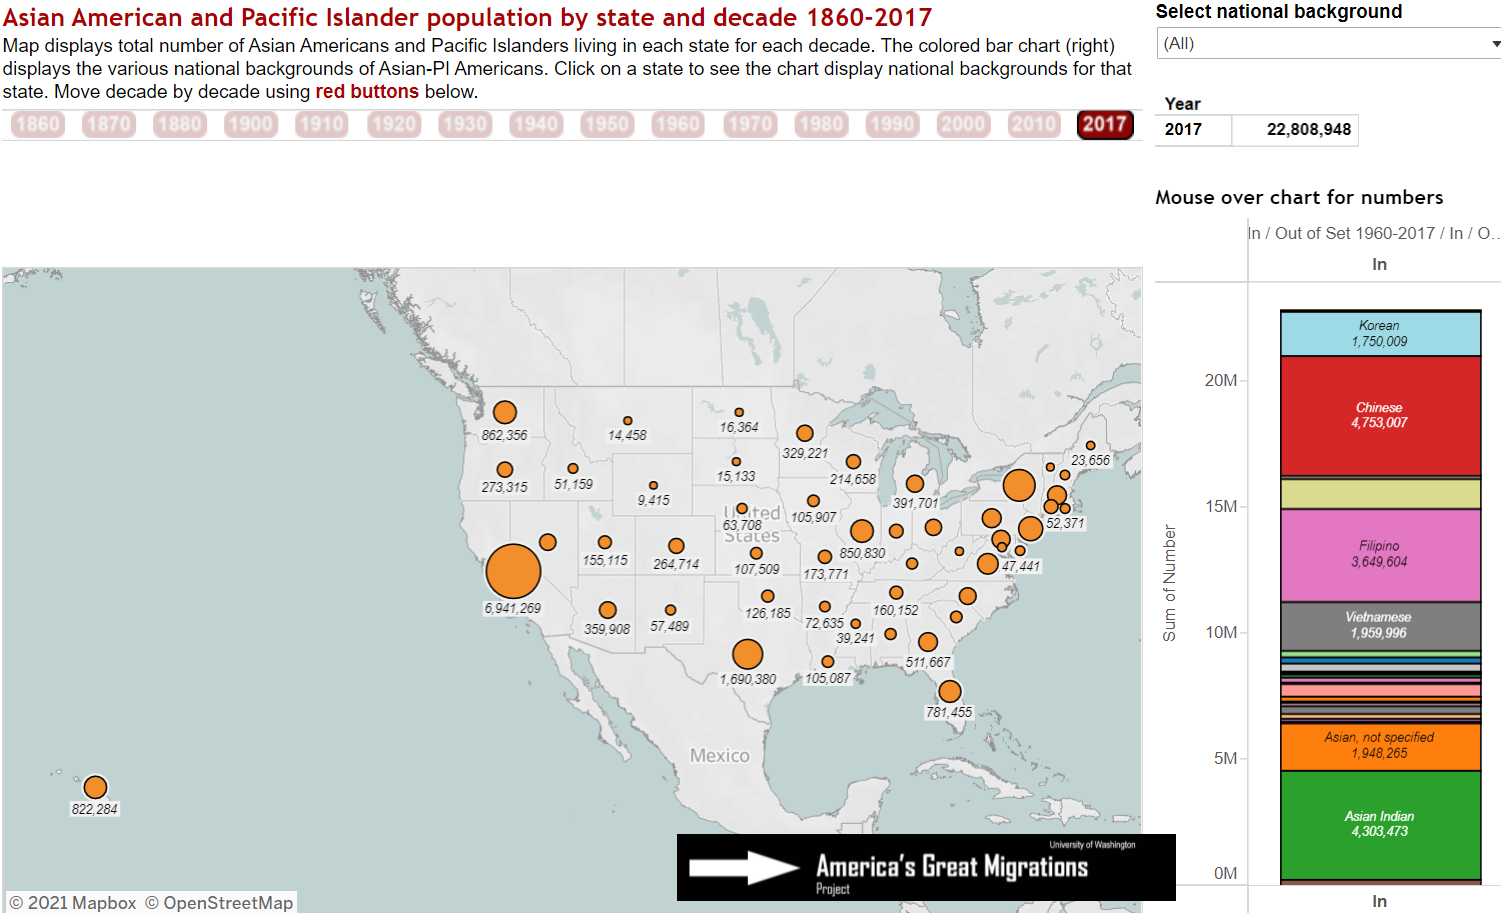
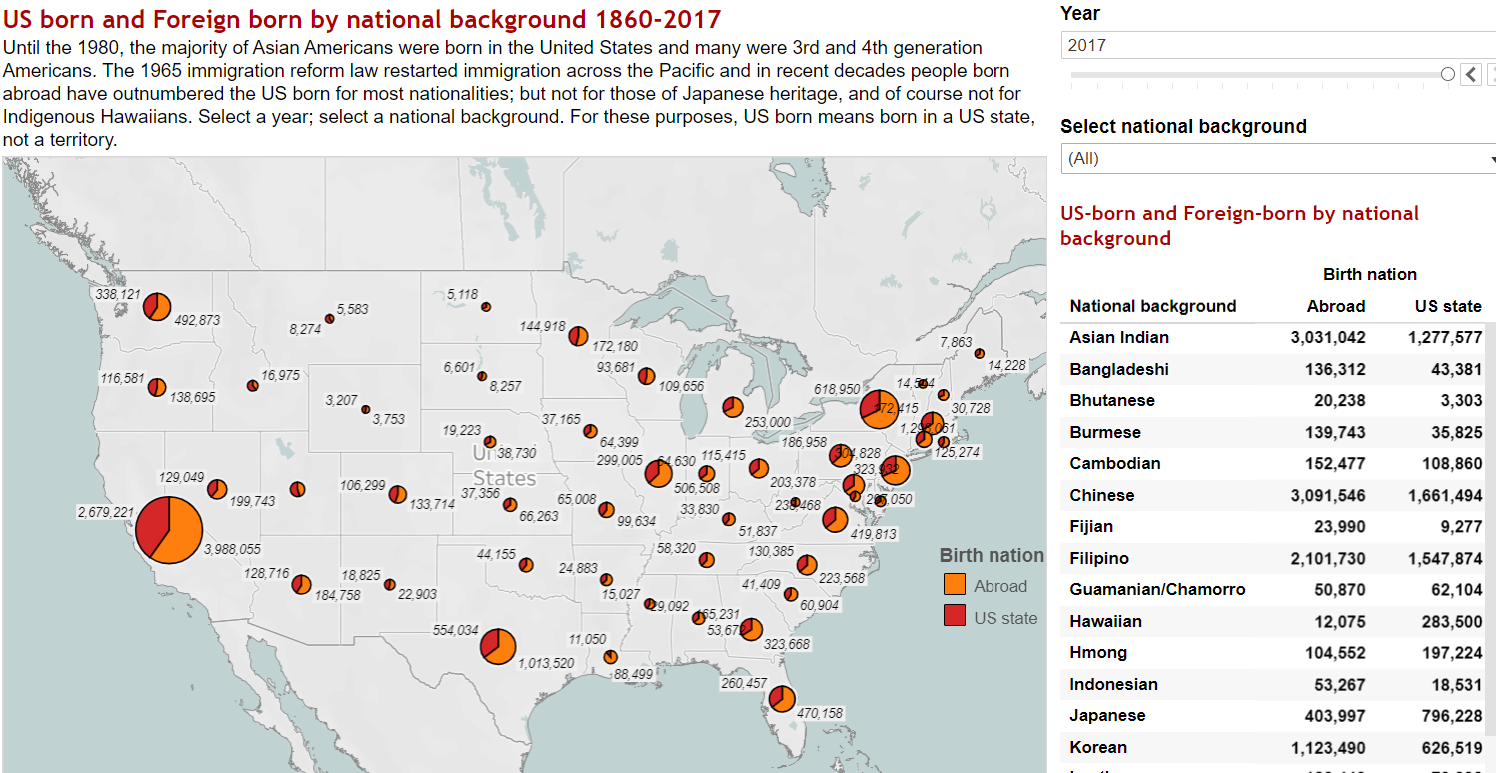 Dramatic migration increases since the 1970s mean that most Asian Americans are foreign born as shown in this 2017 map. Click to explore.
Since 1965
Congress rewrote American immigration law in 1965, ending a system that had imposed drastic restrictions on people from Asia, Africa, and most of Europe. The new law established uniform national quotas and a variety of special statuses. Immigration picked up in the 1970s and has increased each decade since. By 1980 Asian American populations had reached 3.6 million, nearly four times the number twenty years earlier. Twenty years later in 2000, the Census Bureau reported more than 12 million Asian Americans and Pacific Islanders and that number has passed 24 million in the 2020 report.
People have been coming from new locations in the last fifty years. Where the population before the law changed consisted largely of persons of Japanese, Chinese, Filipino, native Hawaiian, and Korean heritage, since then every country in Asia and the Pacific has contributed. And where before most were US-born second or third generation Americans, in recent decades the population of nearly all heritages is largely foreign-born. Japanese Americans are the exception. Immigration from Japan has been modest in comparison with other countries. That means that Japanese Americans, once the largest Asian origin group, are now less numerous than Chinese, Asian Indian, Filipino, Vietnamese, and Korean Americans.
Vietnamese, Cambodians, Laotians, and Hmong people have come to the United States under the refugee provisions of American law. Would-be migrants from most countries are admitted either because they qualify under their nation's annual quota or because of family connections or professional-class work skills. In 1975, Congress added a special status for former allies of the United States who fled Vietnam and neighboring countries. The maps allow you to track the decade-by-decade numbers and settlement geography of these populations.
Mapping Asian American and Pacific Islander Migrations
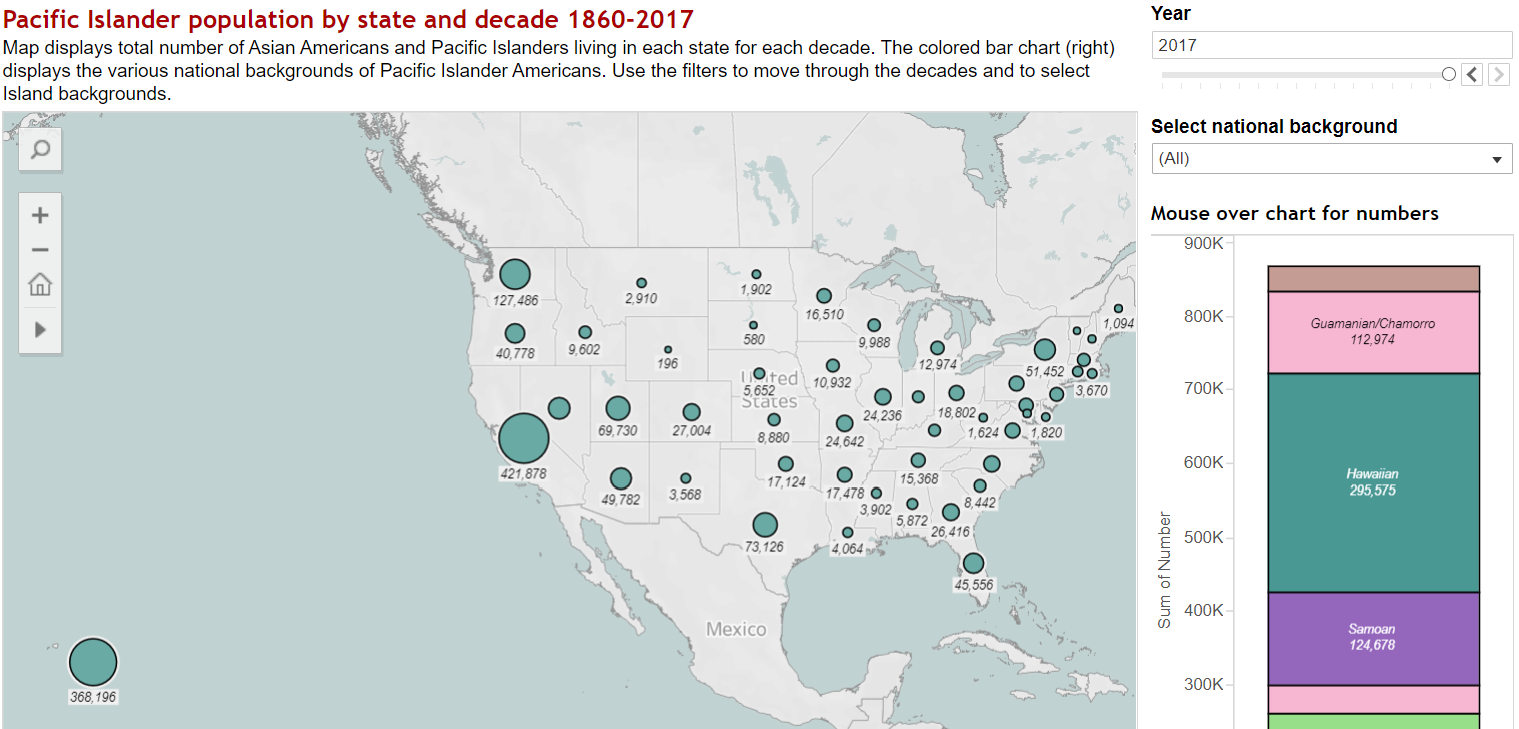 Pacific Islander migration geography is shown in this set of maps
Next, please explore the six maps and charts that show the dimensions of migrations from Asia and the Pacific Islands. These interactive visualizations allow you to examine separately the volumes of migration of people of each national heritage and the states in which they settled while distinguising between those born abroad and those born in the United States. Explore