Natural Convection
Natural Convection Experiments
The experimental observation of unsteady natural convection during
fiber drawing led to the numerical prediction of a new type of unsteady natural convection. To further investigate the flow behavior a new experimental system was developed with an annular geometry.
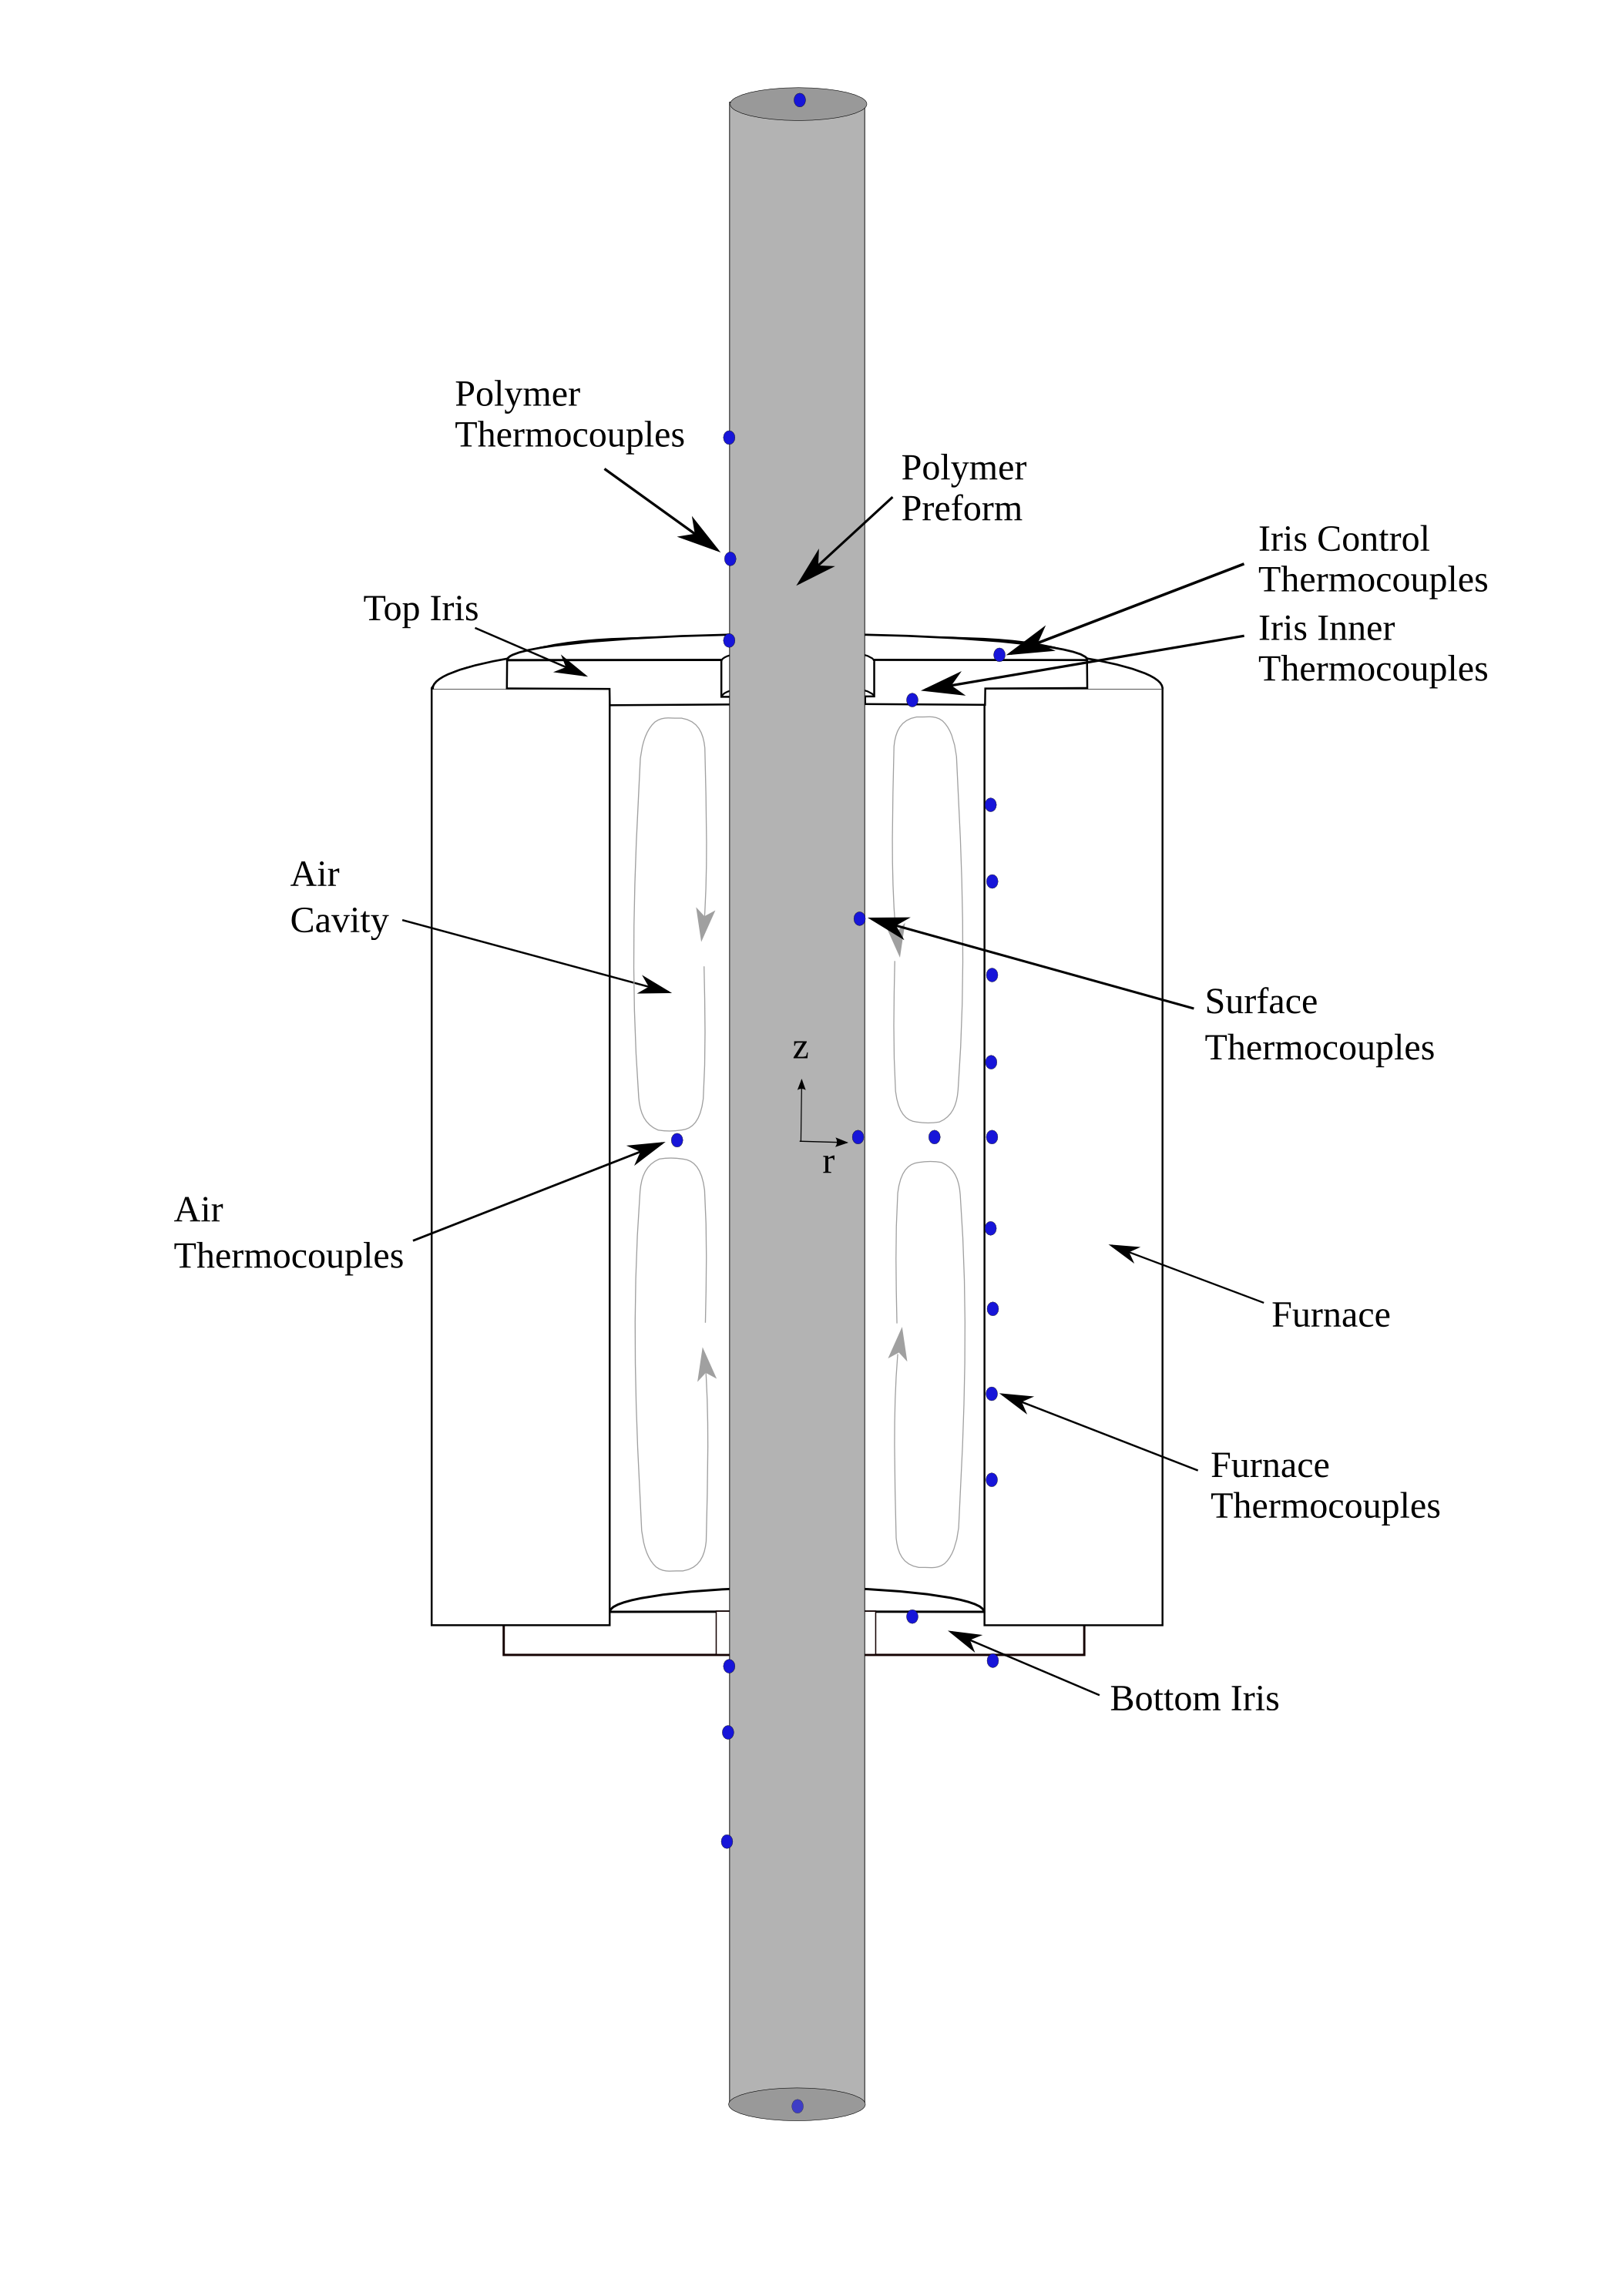
Experimental system for the annular geometry. Blue dots represent thermocouple locations.
The experimental system is characterized by a non-isothermal outer wall and a dependent inner preform temperature based on the manufacturing environment for POF.
At high Rayleigh numbers the air in the a flow pattern become unstable and starts to oscillate. Spectral analysis indicates that as the top iris temperature is decreased the system undergoes a Hopf bifurcation followed by a frequency doubling route to chaos. The system undergoes several distinct regions of transition, first the steady region (no oscillations), followed by the oscillatory region, a quasi period region and finally chaos.
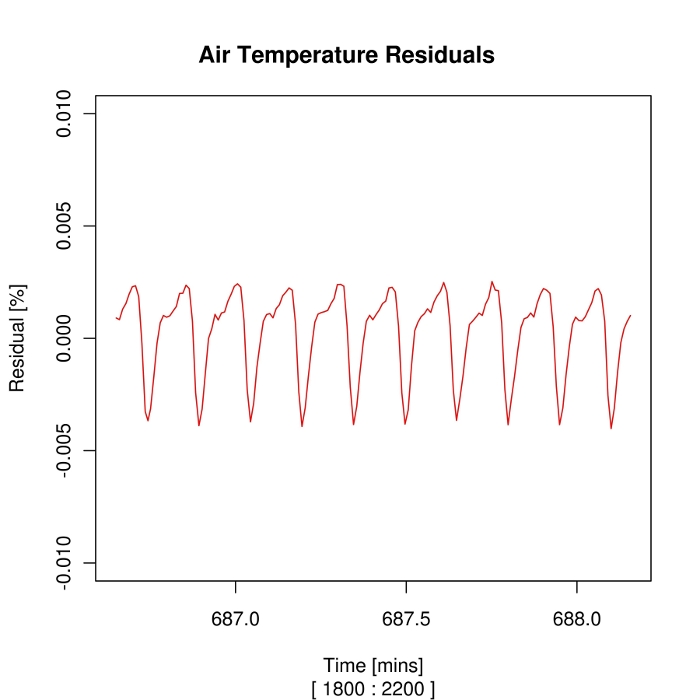
Example experimental results for the oscillatory region.
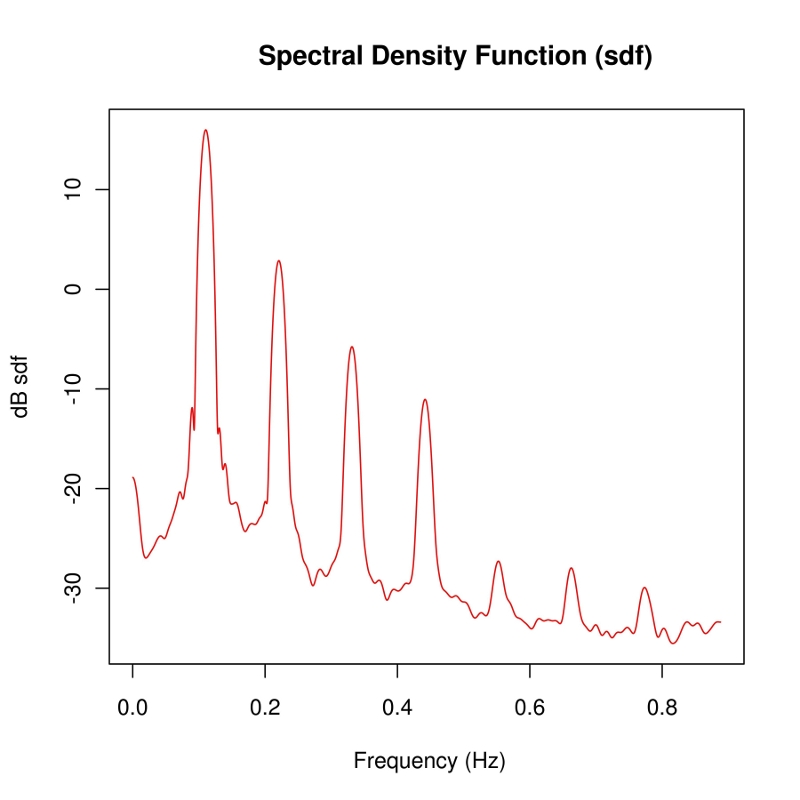
Example frequency calculation for the oscillatory region. Several strong frequencies appear, near 0.1 Hz and 0.2 Hz.
The experimental work indicates the existence of multiple cells in the air cavity.
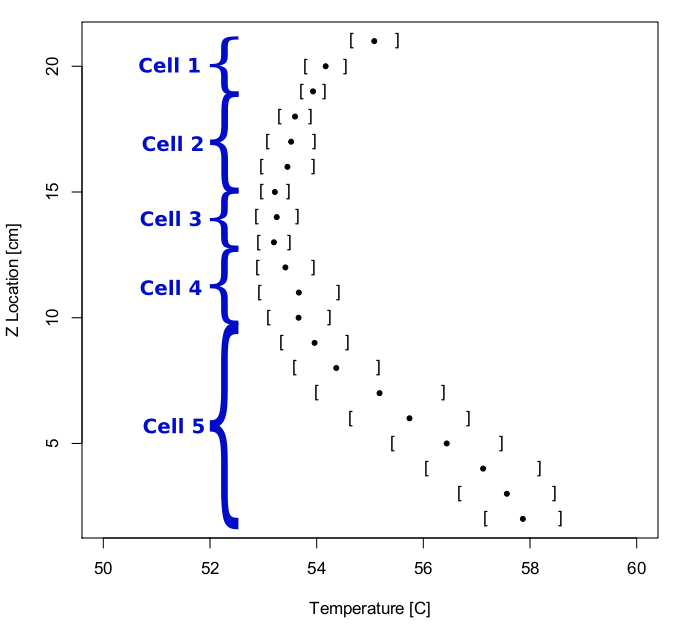
Multiple cells observed in the experimental work. The mean temperature is shown with a dot and the bars represent the standard deviation.
Natural Convection Simplified Model
Many CFD models have been developed to help understand the experimentally observed natural convection system. A simplified model for an annular geometry with non-isothermal walls has shown exciting dynamic system properties.
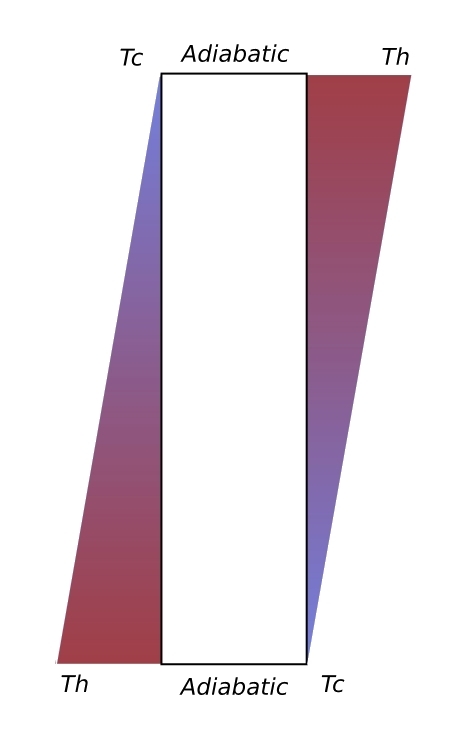
Boundary conditions for the simplified model.
The model results indicate that as the Rayleigh number is increased a Hopf bifurcation occurs. In the rectangular geometry the system transitions to chaos (in the center of the cavity) and then returns to a steady oscillatory behavior after the formation of a third cell in the center of the cavity.
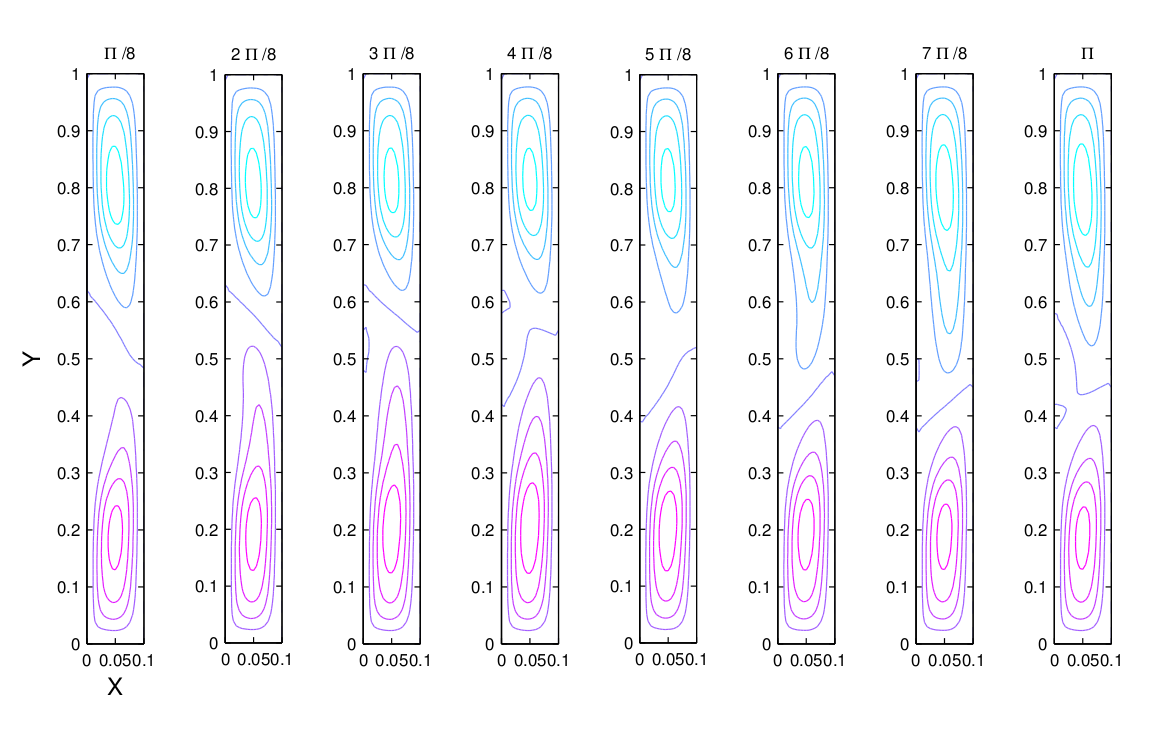
Streamfunction for one period of oscillations at low Rayleigh number.
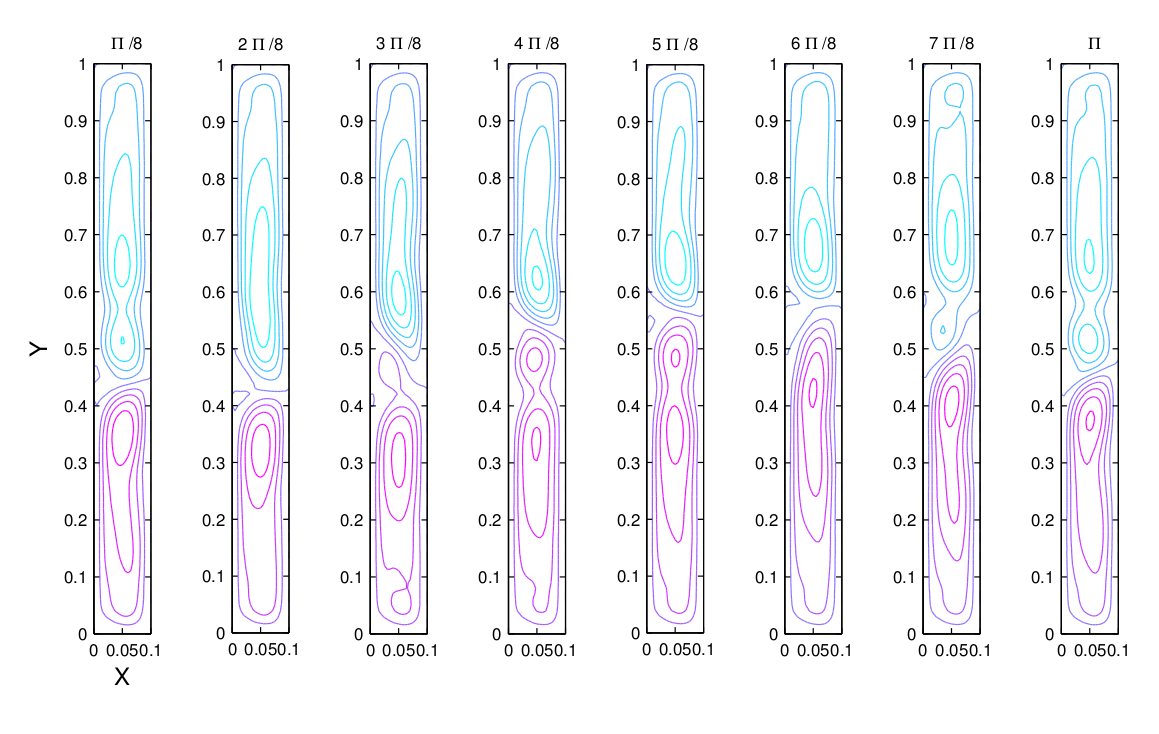
Streamfunction for one period of oscillations at high Rayleigh number, after a third cell has formed in the center of the cavity.
The frequency analysis shows the results more clearly, where initially 2 frequencies occur, then 4 frequencies, and then chaotic behavior is observed. The chaotic region is followed by a transition back to steady oscillatory behavior. This is a unique dynamic system behavior which has not been reported in prior work.
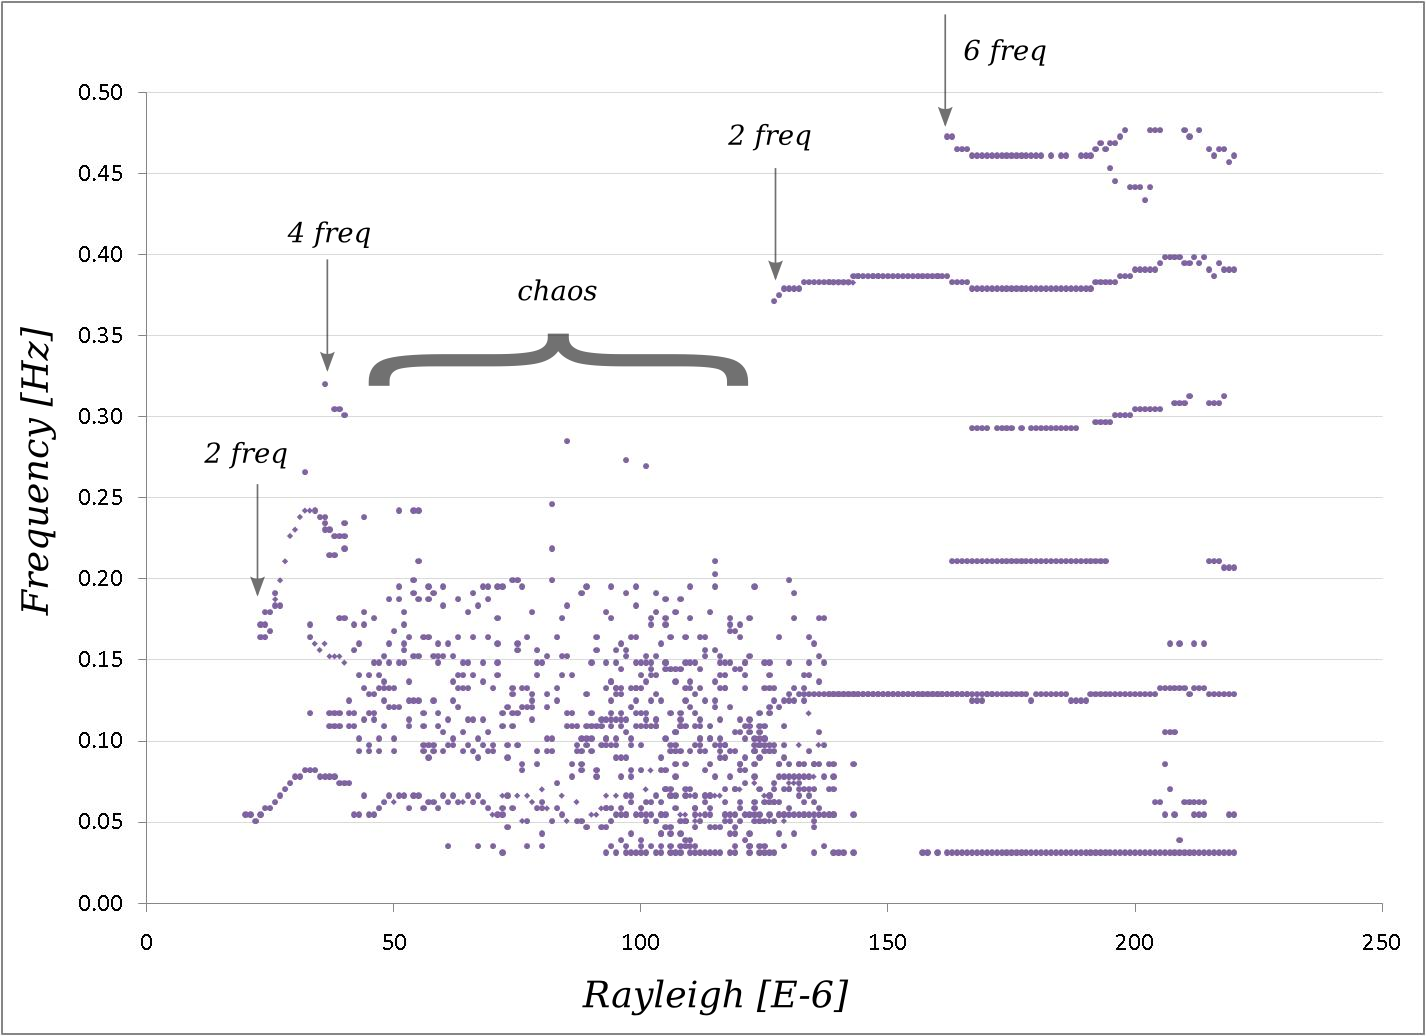
Frequency behavior as the Rayleigh number is increased in the rectangular cavity.