
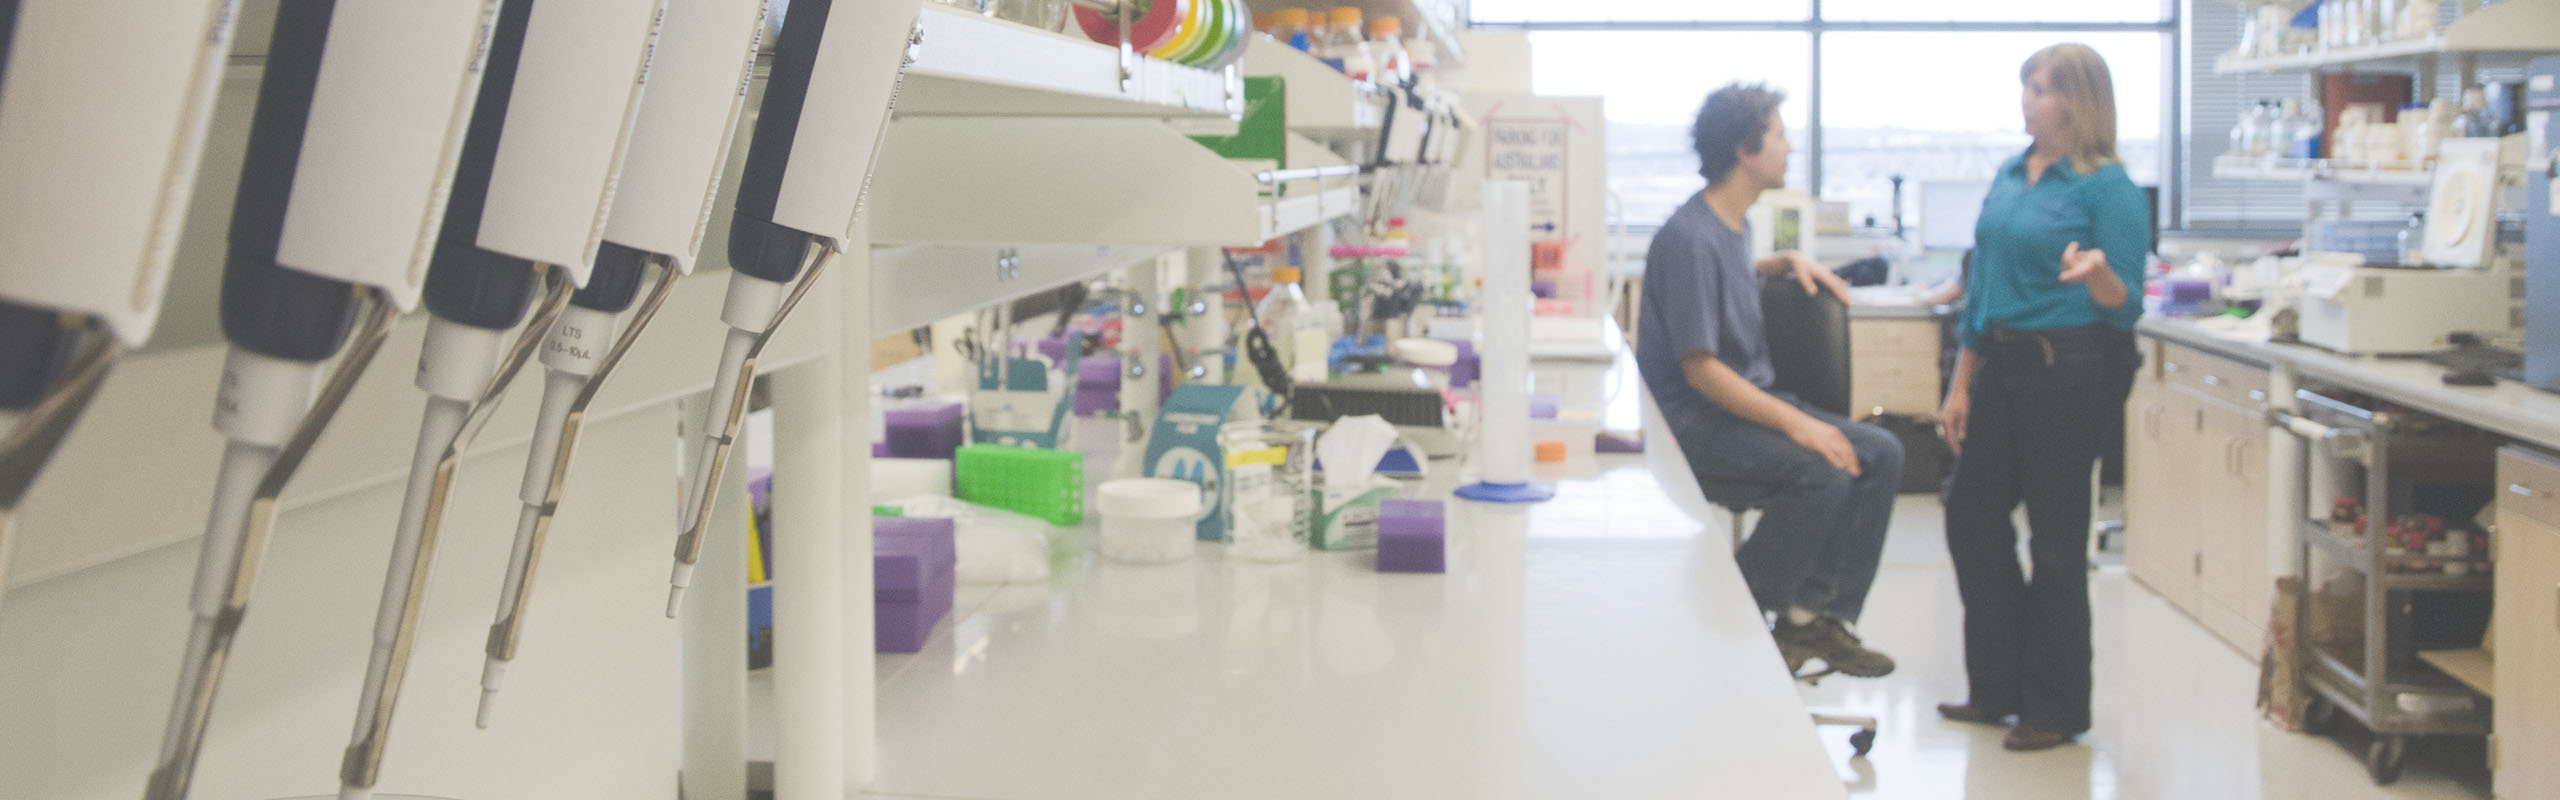


The YRC is a NIGMS Biomedical Technology Research Center based at the University of Washington in Seattle. Click to learn more about us.
Learn more about the technologies being developed by the YRC and how they are being applied to biomedical problems.
Learn how to collaborate with the YRC–leveraging our technology and expertise in your research.
Active Projects
Collaborators Since 2011
Annual NIH Dollars Impacted
YRC Publications
New Research
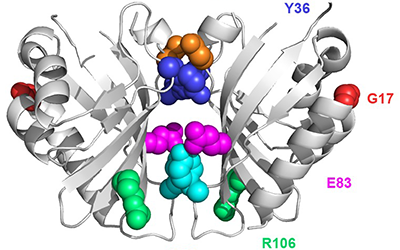
We are developing technology to produce biosensors based on a ligand-binding domain (LBD) that may, in principle, be applied to any target molecule. The power of this method is illustrated in this paper by development of biosensors for digoxin and progesterone.
Read more in eLIFE or in PubMed Central.
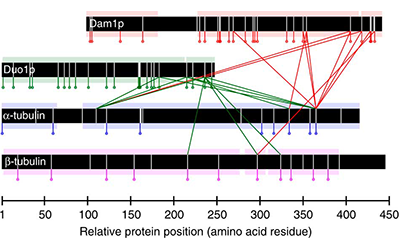
In this work, we combine the results of protein cross-linking mass spectrometry with iterative structural modelling to determine the molecular architecture of the 10-member Dam1p protein complex in S. cerevisiae. Using this technique, we can model conformational changes resulting from binding with microtubules.
Read more in Nature Communications or in PubMed Central.
Latest Publications
Fuller, GG et al. (2020) RNA promotes phase separation of glycolysis enzymes into yeast G bodies in hypoxia. Elife 9 :. PubMed PMID:32298230
Chen, Z et al. (2020) De novo design of protein logic gates. Science 368 (6486):78-84. PubMed PMID:32241946
Dorrity, MW et al. (2020) Dimensionality reduction by UMAP to visualize physical and genetic interactions. Nat Commun 11 (1):1537. PubMed PMID:32210240
Kim, TK et al. (2020) Time-resolved proteomic profile of Amblyomma americanum tick saliva during feeding. PLoS Negl Trop Dis 14 (2):e0007758. PubMed PMID:32049966
Pino, LK et al. (2020) Matrix-Matched Calibration Curves for Assessing Analytical Figures of Merit in Quantitative Proteomics. J. Proteome Res. 19 (3):1147-1153. PubMed PMID:32037841