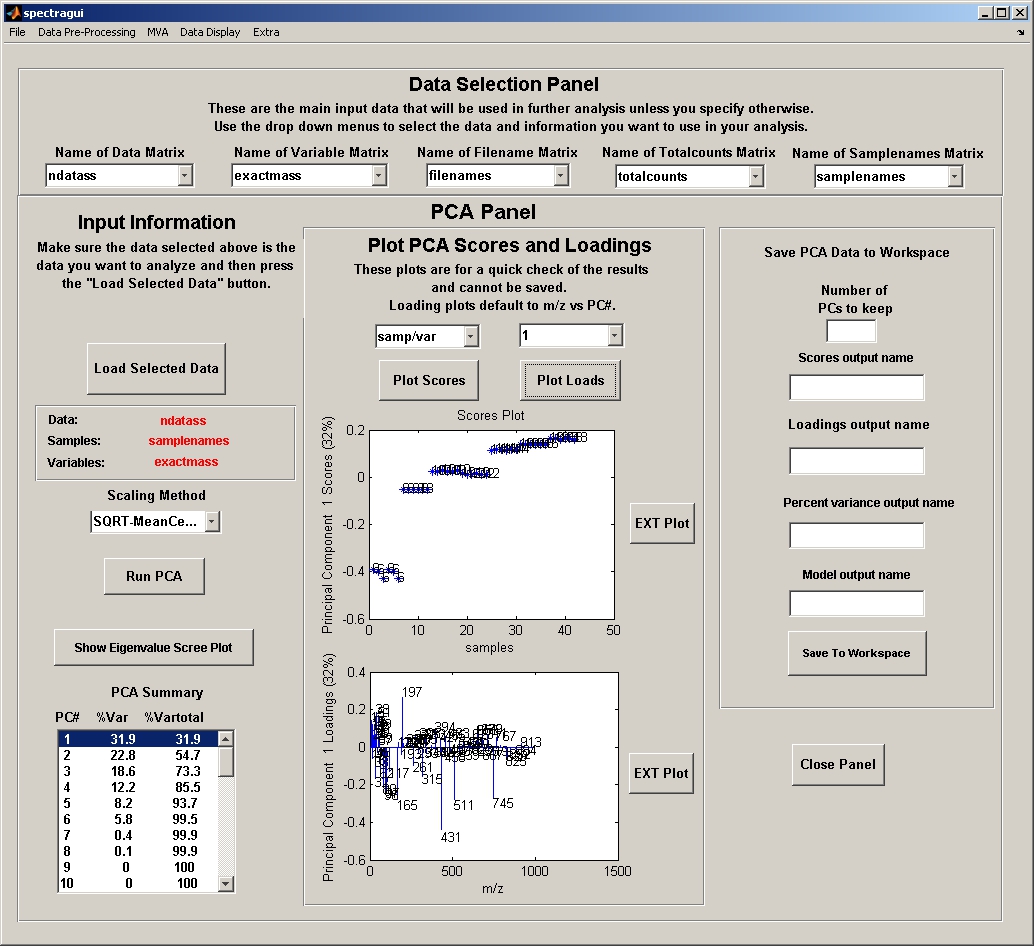
SPECTRAGUI Features
Import peak area table (Iontof)
Import from workspace
Normalize data
Delete samples (spectra)
Delete Variables (peaks)
Reorganize data matrix
Run PCA
Project data into PCA model
Run DPCA (Descriminant PCA)
Export MVA data to ASCII text
Plot peak area data
Create and plot ratios of peaks (A/B and A/(A+B))
Plot Scores with 95% confidence limit
Plot and label Loadings
Create external Matlab plots
Peak ratio maker
Find correlated peaks function
PC Data Browser - to look at relative intensity trends for PCs beyond PC1.
New in v2.9
Improved colors for plots
Colors are consistent for each sample in bar plots and scores plots
Tutorials for the Spectragui can be found here:
To obtain a copy of the NB MVA Toolbox you must follow these steps:
1. Read and accept the licensing terms
2. Fill out the form
3. Download the software
4. Follow the installation instructions
To proceed to steps 1 and 2 follow this link

