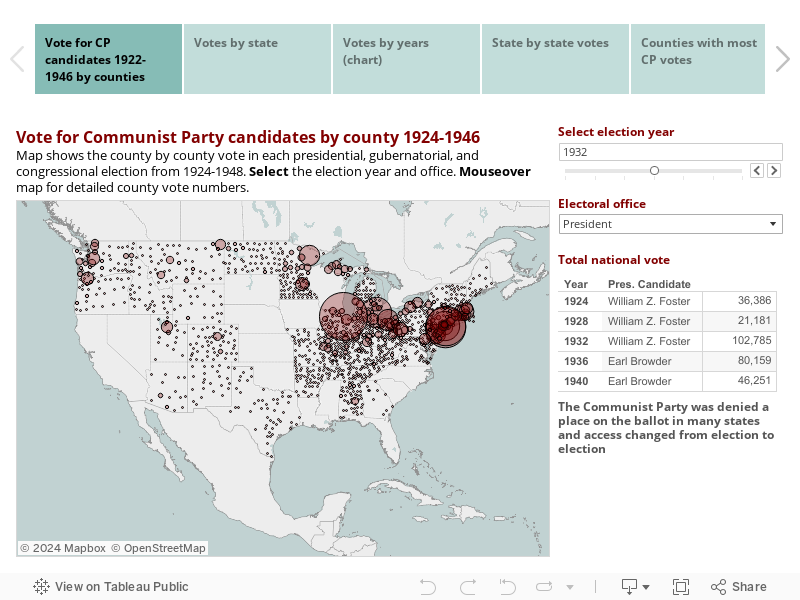
The Communist Party devoted energy and resources to electoral campaigns starting in 1922. Party leaders did not expect to win, but they expected members and followers to support the ticket. Election tallies thus provide an indication of how many voting age citizens were loyal Party supporters in any year and place. Communist candidates were able to win about 100,000 votes in several elections during the 1930s and in Senate races in 1940 topped 115,000. These figures may serve as best estimates of the numbers of CP loyalists during party's heyday. The maps and charts show the geography of party strength, detailing the number of votes for Communist Party candidates for each county and every electoral contest from 1922 to 1946. Sources are explained below along with brief notes about CP electoral strategies and challenges. The maps are hosted by Tableau Public and may take a few seconds to respond. If slow, refresh the page. See other CP maps.
Move between six maps and charts by selecting tabs below
Notes: Communist candidates appeared under several party labels in the 1920s, including the Workers Party of America. Many states refused to list Party candidates on their ballots, especially in the South where Party membership was weak in any case. But ballot access was also an issue in California before 1934, in Illinois after 1932, and Ohio after 1936. The CP lost ballot access in other states after 1941. Strategy shifts also affected what we see in these maps. Pursuing Popular Front alliances beginning in 1936, the Party supported progressive Democrats in many races in 1937 and 1938 but returned to its go-it-alone stance in 1940 in the wake of the Hitler-Stalin pact, running candidates wherever feasible. After the 1941 German invasion of the Soviet Union, supporting progressive candidates again became the priority. The Party offered only a few candidates for Congress or the Senate in 1942 and thereafter ceased running independent campaigns for federal and statewide offices, resuming in 1964.
Sources: Vote charts and maps are based on data from Inter-university Consortium for Political and Social Research. United States Historical Election Returns, 1824-1968 [Computer File]. ICPSR00001-v3. Ann Arbor, MI: Inter-university Consortium for Political and Social Research [distributor], 1999-04-26. http://doi.org/10.3886/ICPSR00001.v3.
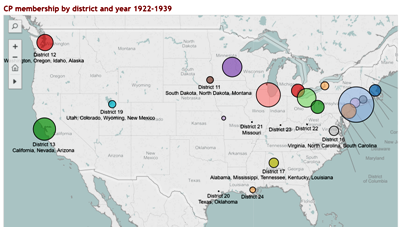
Four maps and charts track Communist Party membership by district during the party's heyday from 1922 to 1950. The CP developed a unique geography, centered in big cities of the North and Pacific West.
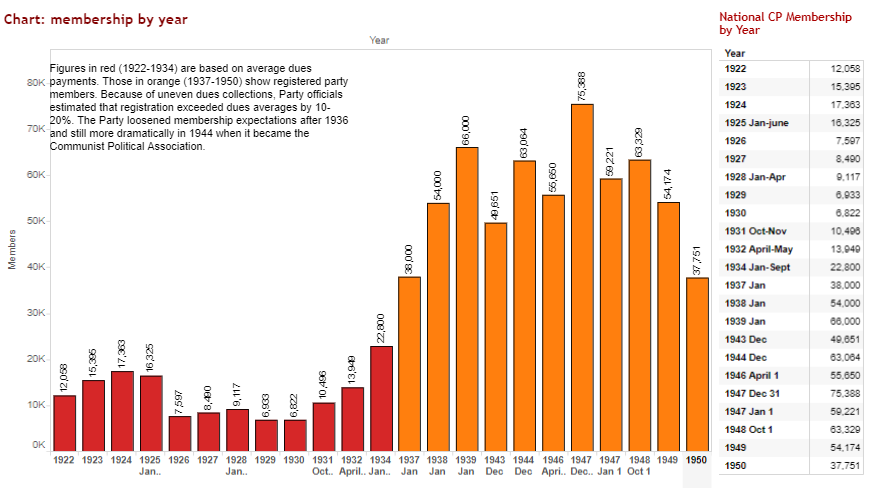
Membership levels remained below 20,000 until 1933 and then surged upward in the late 1930s, reaching 66,000 in 1939, falling off during the Nazi-Soviet detente, then rebuilding after 1941 as the US and the Soviet Union joined in a World War II alliance. Party membership surpassed 75,000 at the start of 1947 before starting its Cold War decline.
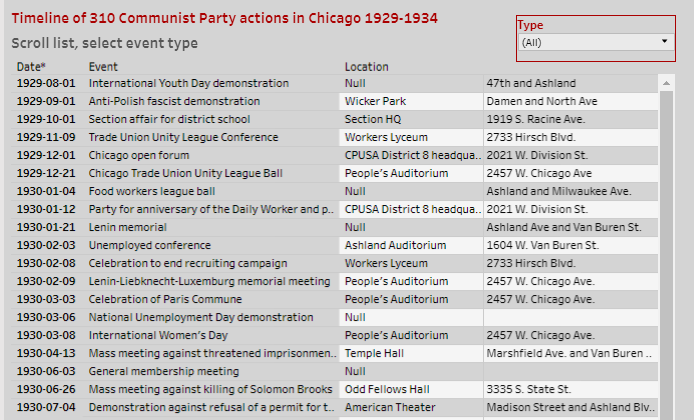
Based on her book Red Chicago, Randi Storch reveals the intense geography of CP activism in a short article accompanied by interactive maps and a timeline/database of more than 300 marches, demonstrations, mass meetings, organizational meetings, picnics, dances, and other actions.
More than sixty years ago, the Civil Rights Congress, affiliated with the Communist Party, engaged in a campaign to hold the United States accountable for genocide against African Americans. We map 152 incidents that the Civil Rights Congress offered as evidence in support of this claim. These killings of unarmed Black men and women by police and by lynch mobs took place between 1945 and 1951. They are displayed on the interactive map and detailed one by one in a descriptive list.