
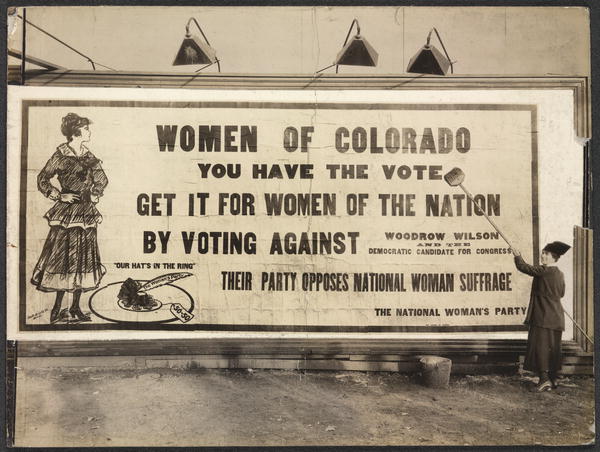
 Part of the vast billboard campaign of the National Woman's Party. Putting up billboard in Denver-- 1916 (Library of Congress)
The Mapping American Social Movements Project is used in hundreds of classrooms at college and high school levels. The maps, charts, and data tables lend themselves to many kinds of observational and interpretative exercises. Here are several discussion questions for the Woman Suffrage unit.
1) This exercise uses the four tabs on the Timeline and Map of Woman Suffrage Legislation State by State page. On the first tab, move through each year from 1869 to 1899. In which states and regions was the suffrage movement most active and most successful? Where was the movement least active and successful? What might explain these patterns? Now look at the years 1900-1909. What is different? What can you say about the movement's strategy and geography in these years? Finally look at 1910 to 1919. What changed? Did the geography of activism and success change?
2) This exercise uses the four tabs on the Timeline and Map of Woman Suffrage Legislation State by State page. On tab 2 (Legislation passed or defeated each year), pay attention to the ratio of successes to failed pieces of legislation. Does this ratio confirm what you already knew about the history of women's suffrage in the US? If not, what about this map challenged your assumptions? Does this map tell you anything about the strategy and persistence of suffrage activists?
3) This exercise uses the four tabs on the Timeline and Map of Woman Suffrage Legislation State by State page. On the first tab, pay attention to the green colored states as you move through each year 1869 to 1919. What does this say about what male lawmakers were prepared to allow? Why might they approve votes for women in certain elections but not all elections?
4) This exercise uses the four tabs on the Timeline and Map of Woman Suffrage Legislation State by State page. On tab 4 (State by state list of measures considered), examine several states in the West and several states in the Northeast and several states in the South. Suffrage activists were more successful in the West. Can you observe any other differences? Were there also more defeats in the West? If so, what does that say about strategy, levels of activism, or access to the legislatures in the three regions?
5) This exercise uses National Woman's Party: a year-by-year history and Mapping National Woman's Party Offices and Actions (Washington DC). Having read the introduction and looked at the first map, do you agree with the assessment that most of the NWP's offices and official actions took place with a tight radius? What would have been the strategic importance of locating near the White House?
6) This exercise uses the National Woman's Party Timeline Story Map. What do the maps contribute to this storyboard? In other words, what aspects do they add or help visualize? How do these maps work in conjunction with the larger maps from this unit?
7) The photo above shows a billboard ad that the National Woman's Party displayed on a roadside in Colorado in 1916. What does it say? What does it mean? Use the chapters of National Woman's Party: a year-by-year history to explain this billboard.
8) Having looked at these maps and completed these questions, consider the different types of information available in this unit. National Woman's Party: a year-by-year history narrates a history of NWP. The photographs in that essay and in National Woman's Party Timeline Story Map provide a visual record. The maps and geographical data represent a third type of information. Are they all equally important? Equally valid? Are any of them complete? Do they contradict each other? What questions should we ask about each of them?
-- Cameron Molyneux and James Gregory (2020)
Additional Resources
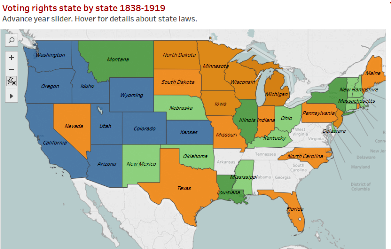 Timeline and Map of Woman Suffrage Legislation State by State 1838-1919
These maps show the fight for votes year by year and state by state as women activists and their allies introduced legislation that often failed and at other times yielded only partial voting rights, often limited to school elections or in some cases only municipal or the presidential election. Here we show the outcome of 249 voting rights measures considered by state legislatures.
 National Woman's Party:
a year-by-year History 1913-1922
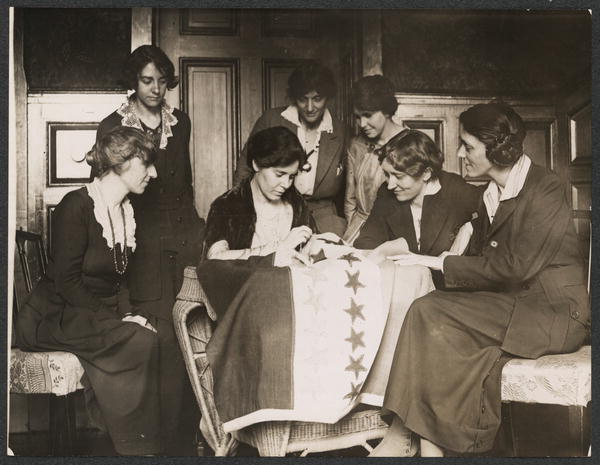
This illustrated essay chronicles the actions and accomplishments of this remarkable social movement while displaying more than 50 photographs from the "Women of Protest: Photographs from the Records of the National Woman's Party" (Library of Congress).
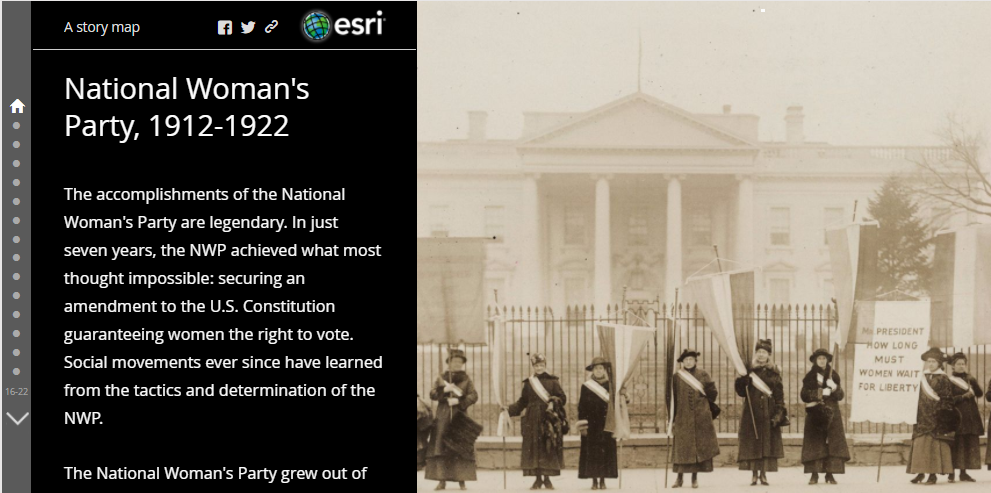
National Woman's Party 1912-1922: Story Map
This esri StoryMap scrolls through a quick history of the NWP mapping locations of key demonstrations and other actions. Includes almost two dozen historic photographs. .
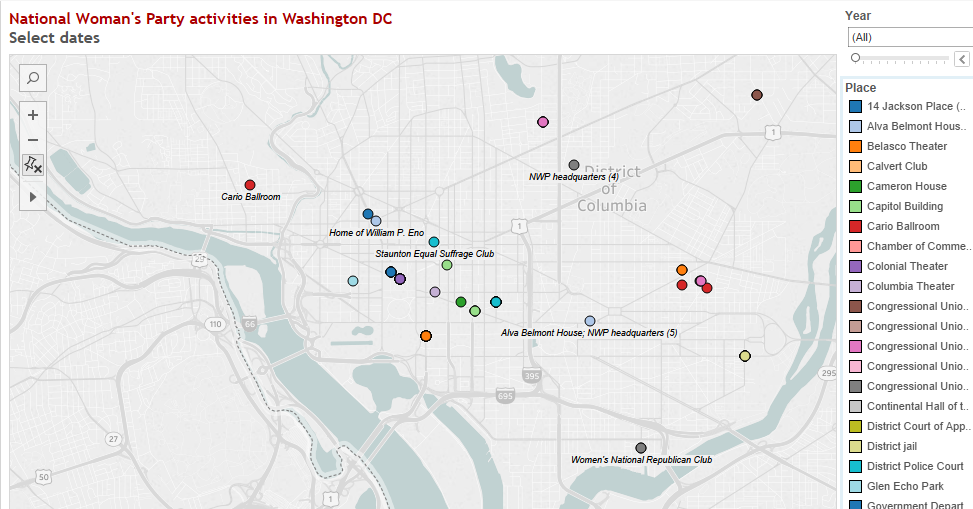
Mapping National Woman's Party offices and actions (Washington DC)
From the beginning, the NWP focused tightly on Washington DC. It's first headquarters was some distance from the Capitol, but soon the NWP moved closer, a mere block from the White House. These maps and timeline show the locations of picket lines, arrests, and meetings in the nation's capital.
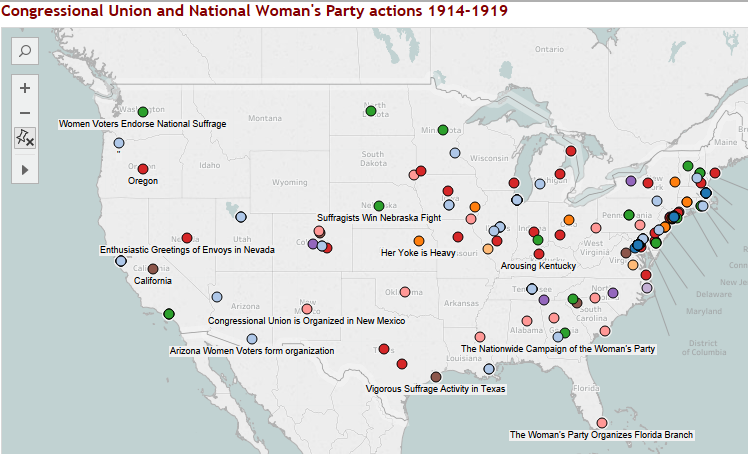
Mapping NWP actions nationwide 1914-1922
Here are maps and charts showing the year-by year geography of the the movement. The NWP organized campaigns in many states while concentrating protest activities in Washington DC. Filter by state and by the type of events.