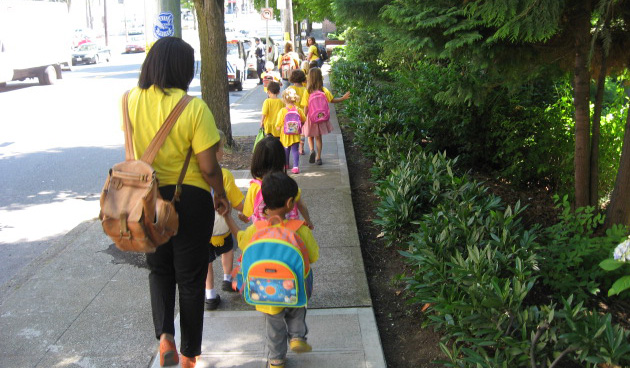
This project analyzed changes in the rates of active school transport captured in the 2016 and 2019 Washington State Student Travel Surveys and also evaluated the likely impacts of Safe Routes to School projects on rates of active school transport. It was part of a long-term collaboration between the University of Washington and the Washington State Department of Transportation to model the environmental determinants of active school transport (AST) in order to help support and promote AST and to ensure the safety of students traveling to school.
The Washington State Student Travel Survey is one of the largest longitudinal travel surveys of school children in the U.S. It collects data on how children, in kindergarten through 8th grade, get to and from school and on possible barriers to walking, biking, and riding the bus. Its main purpose is to help improve student transportation safety and efficiency. Three surveys have been conducted to date, in 2014, 2016, and 2019. In each wave, the survey reached about 10,000 students in nearly 200 K-8 schools in Washington state
Previous analyses of the survey data showed a 16.4 percent increase in children walking and a 56 percent increase in children biking to school between 2014 and 2016. However, the 2019 survey showed a sudden, unexpected drop in the number of students walking and biking to school. An analysis of the longitudinal data set was needed to determine whether the drop in AST could be explained by differences in sampling schemes or reflected an actual drop in the AST rate across the state caused by possible physical, social, and political factors.
This study found that the average AST rate for the 241 schools surveyed in 2016 was 21.2 percent, in comparison to 14.1 percent for the 198 schools surveyed in 2019. The difference in rates was explained primarily by the differences in the schools sampled in the two waves. Schools included in only the 2019 survey lacked characteristics that are known to be associated with higher rates of AST. For example, they were located in neighborhoods with lower street connectivity than schools in the 2016 survey, and they provided less encouragement for AST. In addition, the students included in the 2019 survey were younger, and a higher proportion of them lived farther from school. Differences in walkability scores and walking potential scores between the two waves further confirmed these findings.
Safe Routes to School (SRTS) programs are designed to enable more children to safely use AST and have the potential to realize the positive health and educational outcomes associated with AST. State SRTS programs provide grants to local school projects that support student walking and bicycling to school. The projects generally fall under one or more of five transportation system attributes: engineering, education, encouragement, enforcement, and/or evaluation.
This study’s evaluation of the association between SRTS project awards and rates of AST was based on 94 SRTS projects for which complete project information was available from multiple databases. Projects before 2014 (82) were joined with audit AST data. Those after 2014 (12) were joined to data from the three Washington State Student Travel Survey waves. The majority of projects (53) were found to have produced increases in students walking to/from school; 40 produced increases in the number of students biking; and a few projects resulted in no change in the number of students walking (4) or biking (21). In addition, several schools actually observed decreases in walking (17) and biking (18) after SRTS projects. On average, schools with SRTS projects saw a 33 percent increase in the number of students walking and a 104 percent increase the number of students biking.
Authors:
Anne Vernez Moudon, UW Department of Urban Design and Planning
Xiao Shi, UW Urban Design and Planning
Sponsor: PacTrans

