Restrictive covenants were one of the reasons that across many generations people of color found it difficult to live in Island County. The 1970 census counted only 272 Black residents. Asians numbered only 522. The county population was 96.8% white. The tiny numbers speak to something other than racial segregation. Exclusion was the issue. And its history plays out today in homeownership rates, family wealth, and other effects of exclusion and inequality.
The links below lead to three resources featuring different kinds of maps, lists, and information showing the neighborhoods impacted by racial restrictive covenants and the history of segregation and exclusion.
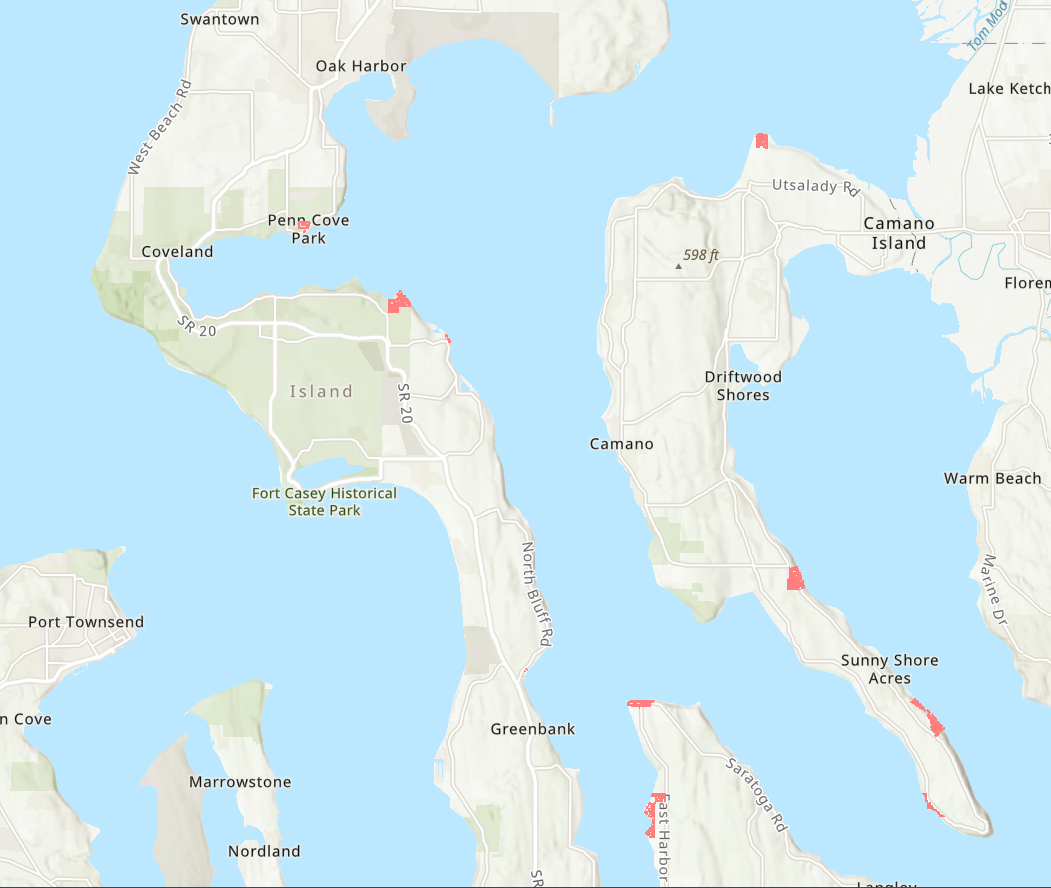
955 restricted parcels
This map shows shows the exact location of 955 properties that carried racial restrictions.
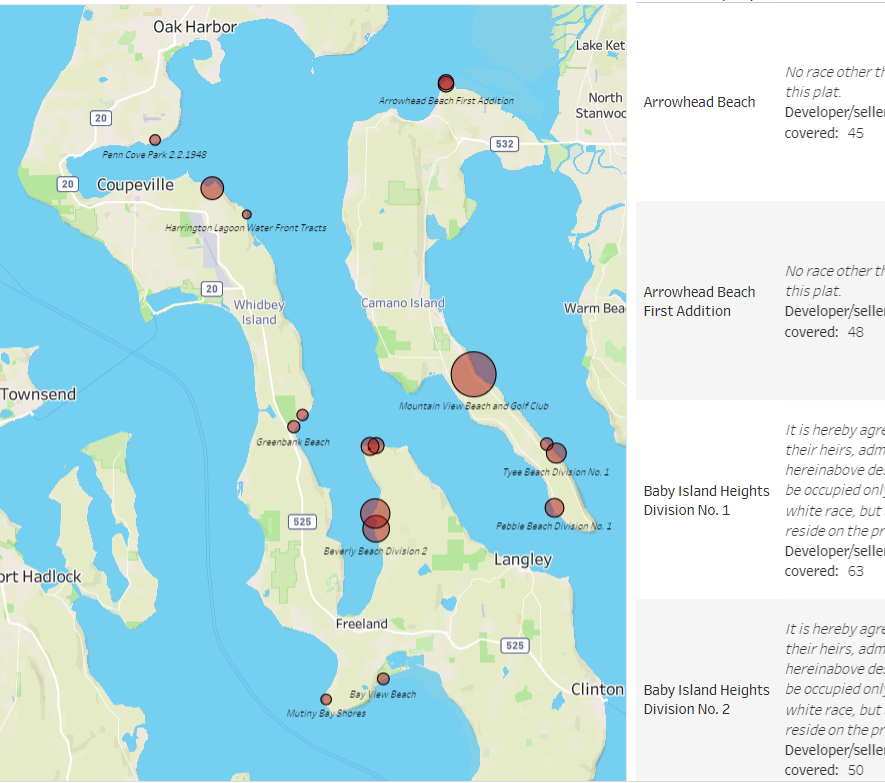
Restricted subdivisions (with documents)
This interactive map shows 26 subdivisons with known restrictions. Scroll the list, read the language of restrictions, learn the names of the developers.
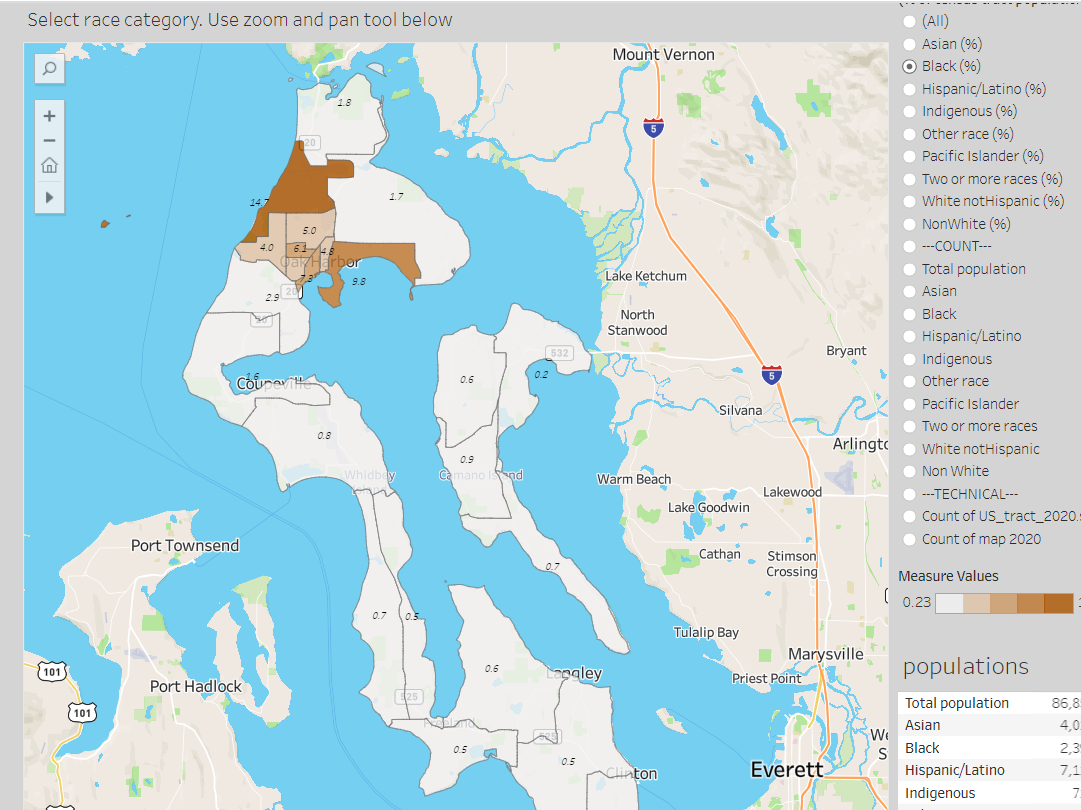
Race and segregation maps
1990-2020
Here we map the neighborhood-by-neighborhood distributions of African Americans, Asian Americans, Indigenous Americans, Latinos, and Whites across four decades.