Restrictive covenants were one of the reasons that across many generations people of color found it difficult to live in Pierce County except at Fort Lewis. In 1970, nearly one-third of the county's Black population were attached to the military. Most of the rest lived in Hilltop neighborhood near the bend in the I-5 freeway. Asian and Latino people numbered only 5,373, a quarter of them stationed at the military base. The census counted 3,343 Puyallup people and other Indigenous Americans in 1970 but the tribe had lost control of reservation lands. Overall, the county population was 93% white. These numbers reflect patterns of both segregation and exclusion. And that history plays out today in homeownership rates, family wealth, and other effects of exclusion and inequality.
The links below lead to five pages featuring different kinds of maps, lists, and information. (1) map showing the locations of restrictive covenants; (2) map showing distributions of African Americans, Asian Americans, Indigenous Americans, Latinos, and Whites across six decades; (3) charts demonstrate the lingering effects of differential access to homeownership. (4) essay narrating the history of racial exclusion. (5) documents and data.
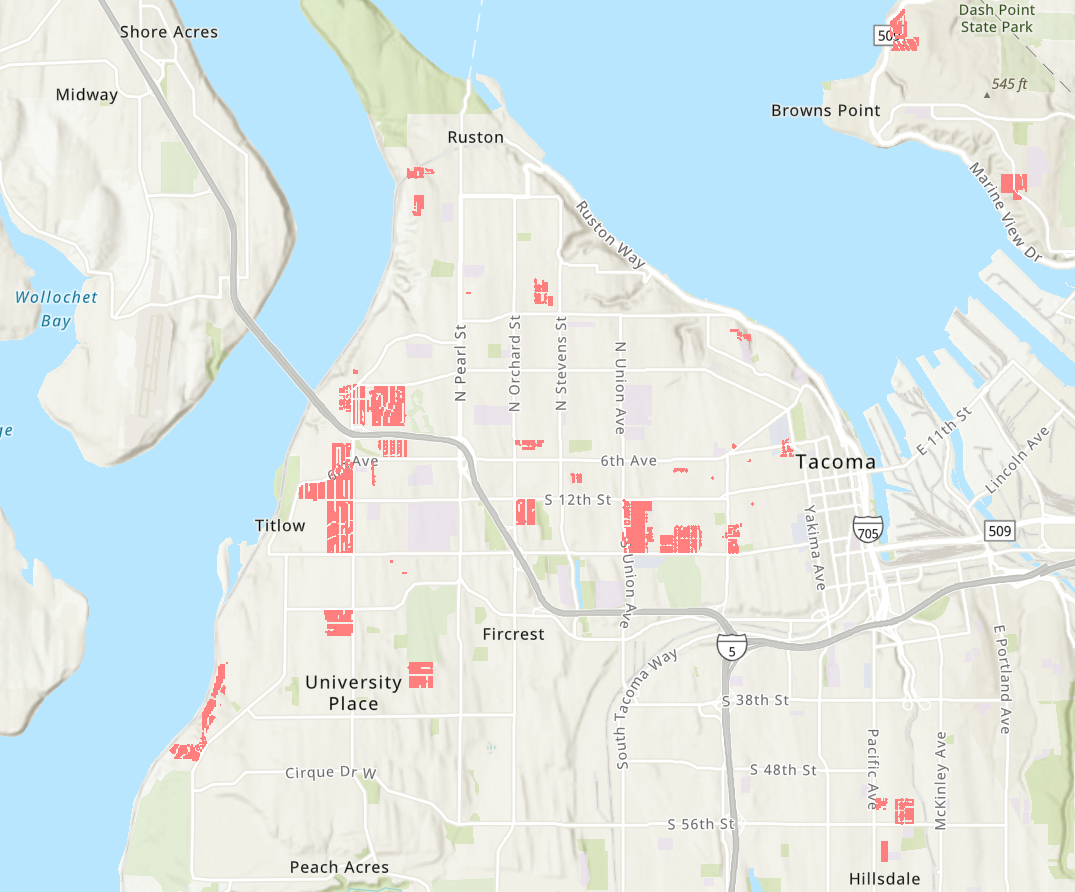
5,400 restricted parcels
This map shows the exact location of more than 5,400 properties that carried racial and sometimes religious restrictions. Zoom to see addresses and restriction language.

Tacoma's History of Racial Exclusion, Segregation, and Housing
This report details the history of racial exclusion in Pierce County, charting both the legal and social enforcement of racial covenants and the struggles to undo them.

Homeownership by race
1970-2022
In 2022, 70% of White families were homeowners compared to only 38% of Black families. Here we track homeownership rates since 1970, showing the alarming disparity in the value of homes and ownership rates.
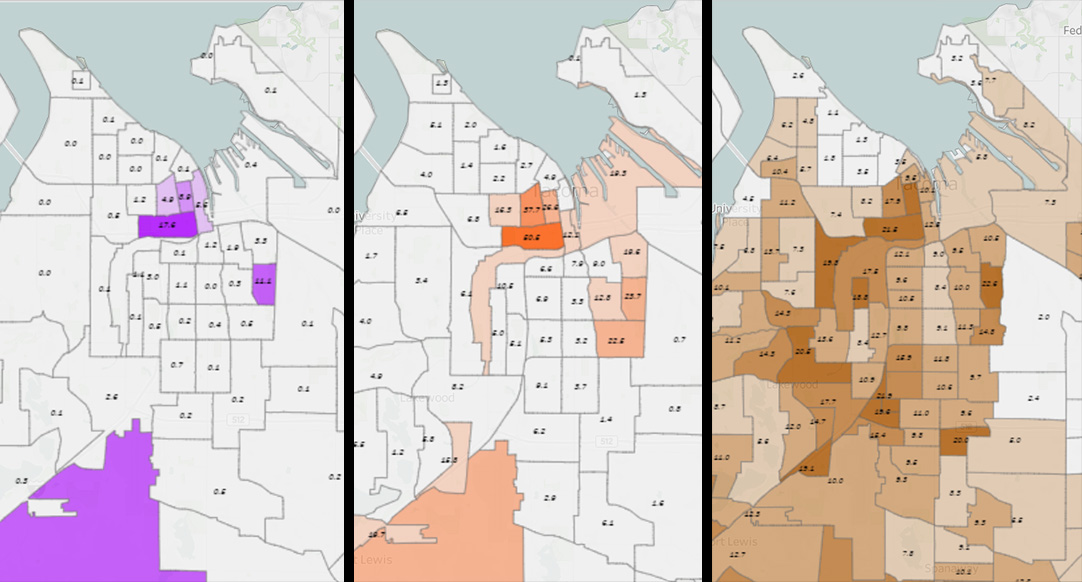
Race and segregation maps
1960-2020
Here we map the neighborhood-by-neighborhood distributions of Black, Asian, Indigenous, Latino, and White people across six decades.
Restriction data and documents
Downloadable documents for 87 subdivisons with known restrictions. Scroll the list, read the language of restrictions, learn the names of the developers.