Our partners at the EWU Racial Restrictive Covenants Project have identified and mapped more than 7,000 properties that were covered by racial restriction covenants in the years that they were legal. The links below lead to three resources featuring different kinds of maps, lists, and information showing the neighborhoods impacted by racial restrictive covenants and the history of segregation and exclusion.
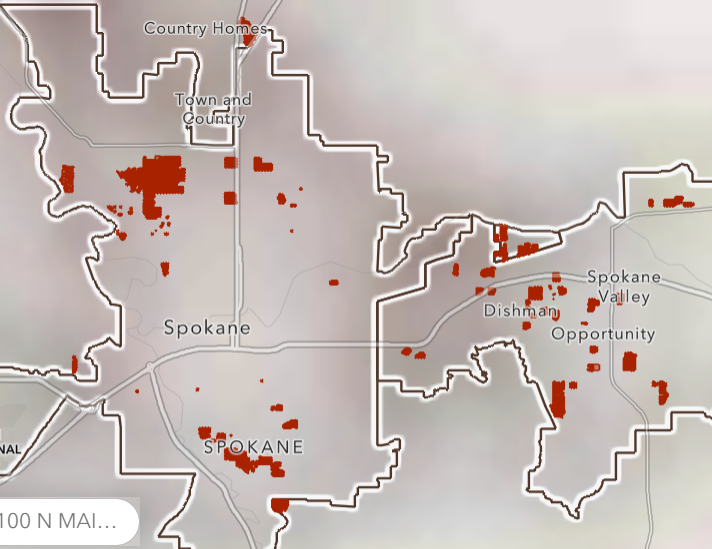
7,000 plus restricted parcels
This map shows shows the exact location of more than 7,000 properties that carried racial restrictions.
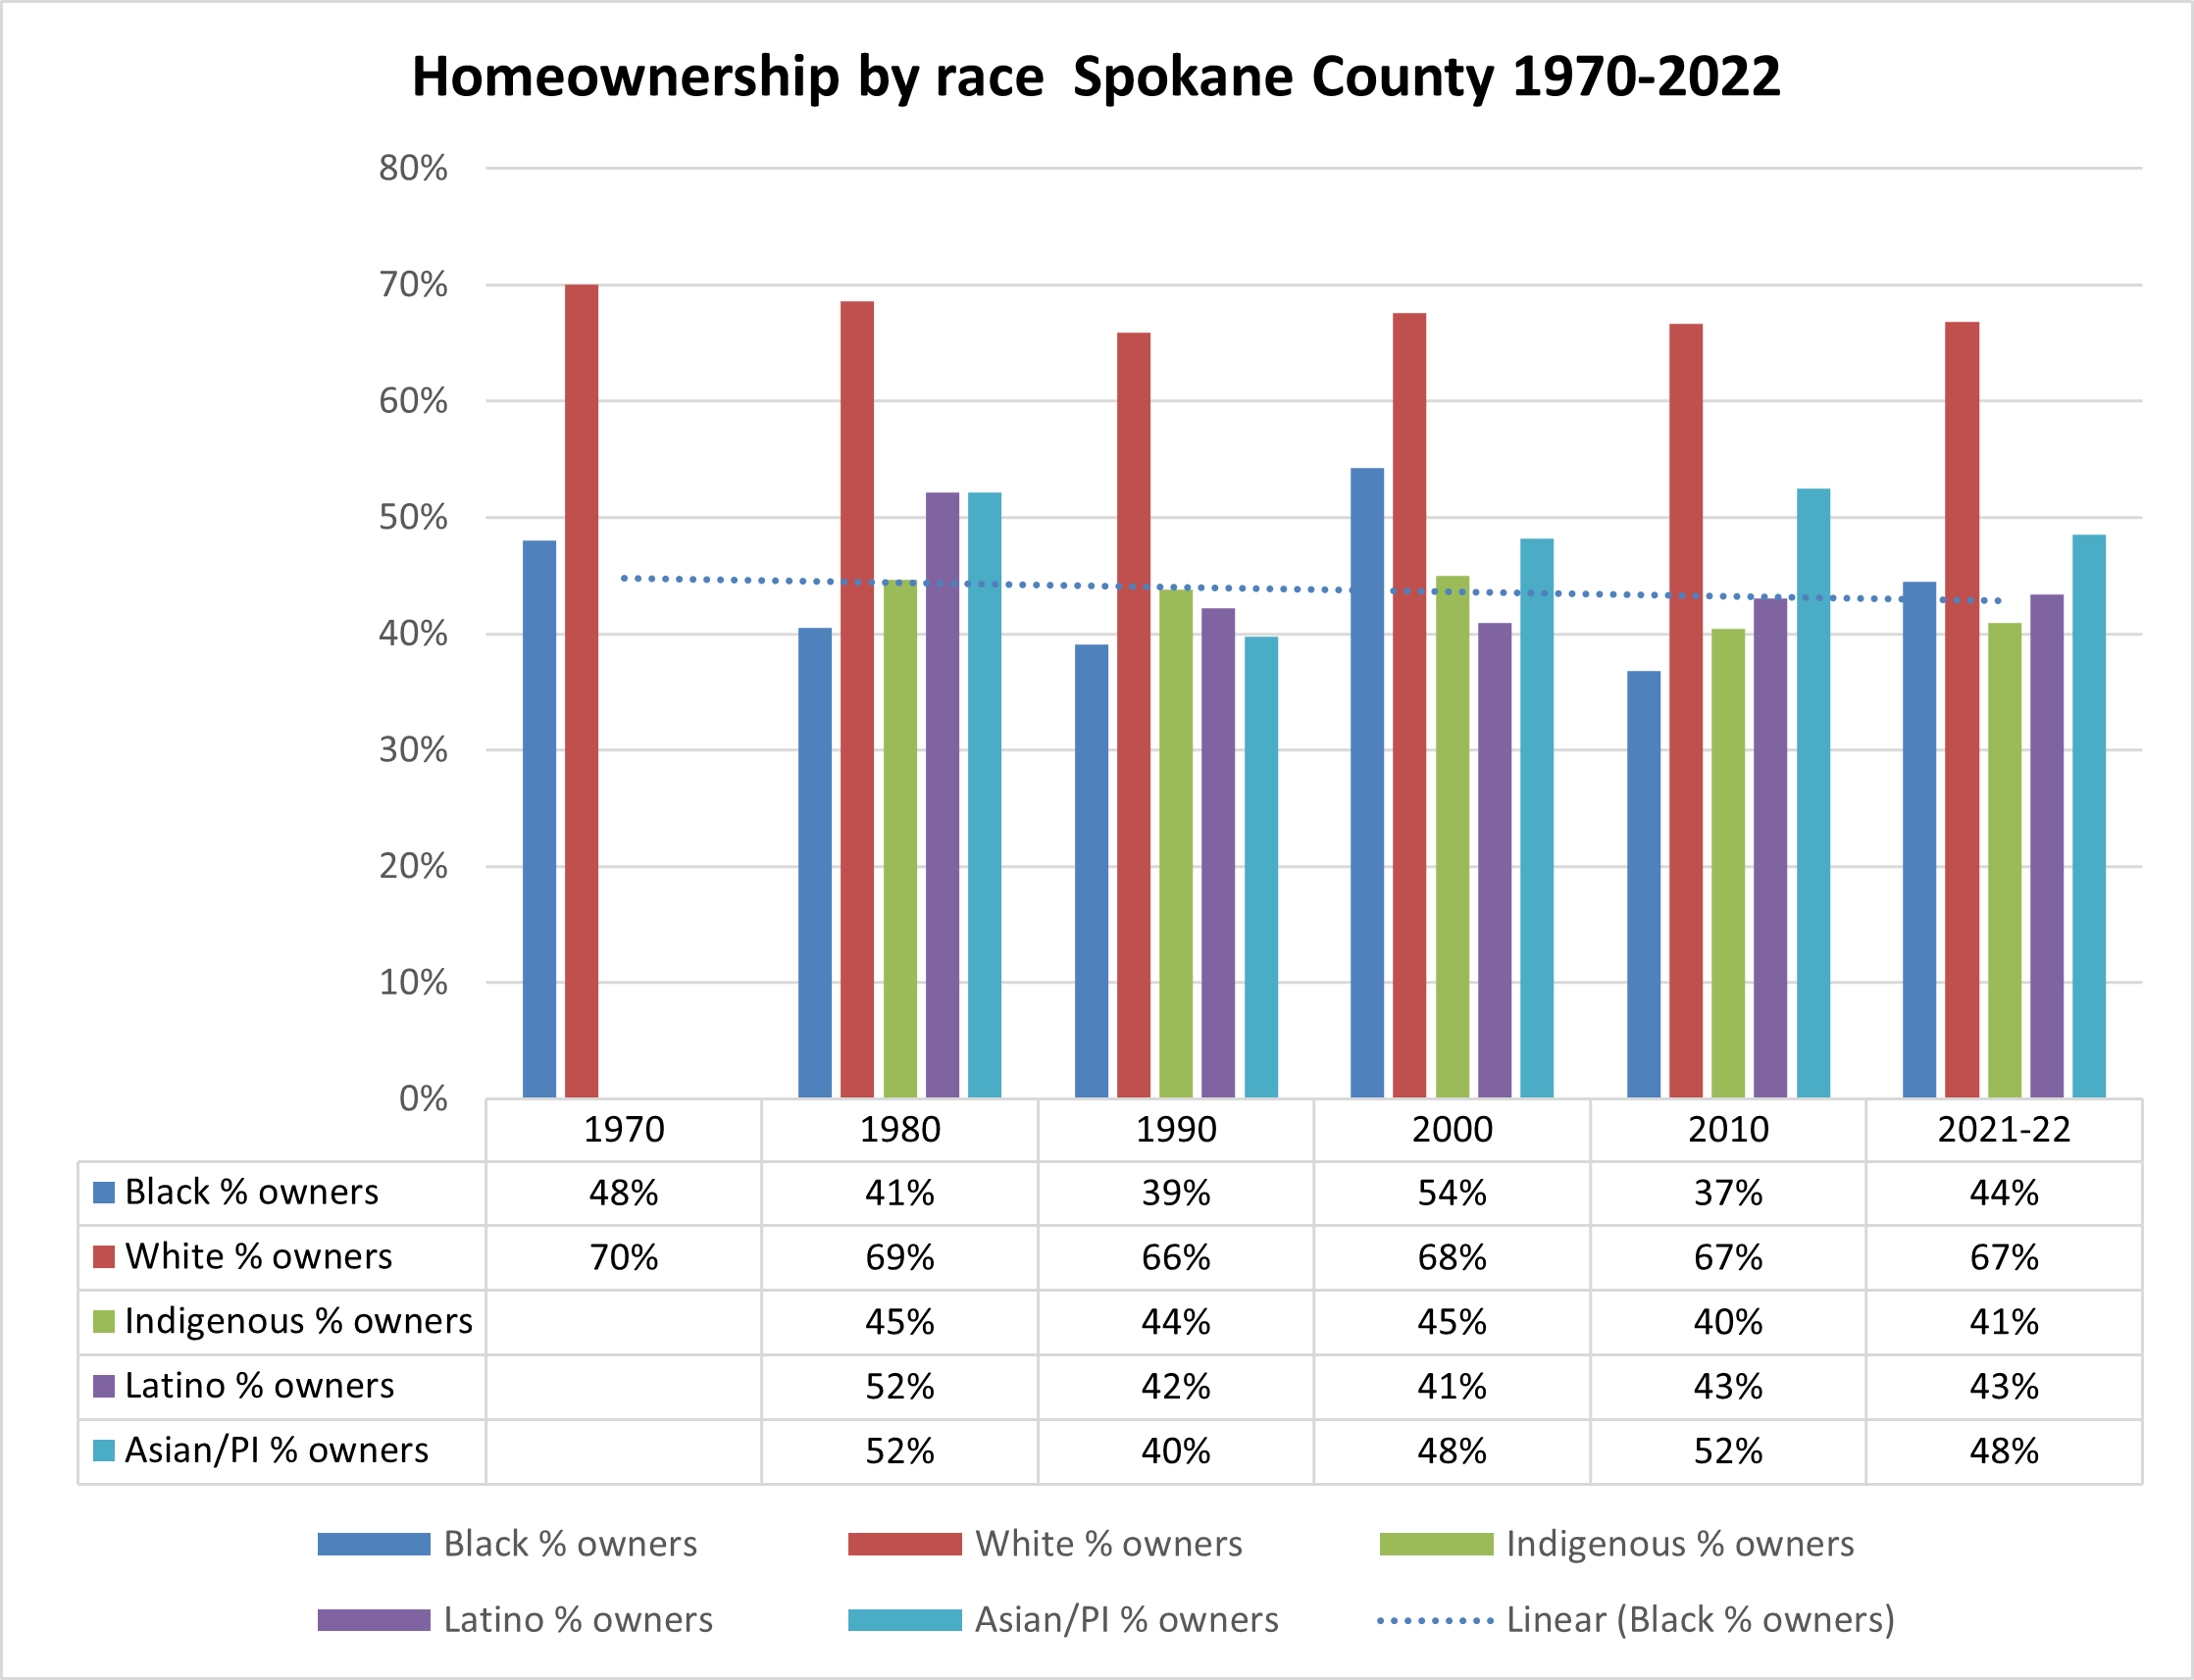
Homeownership rates by race
1970-2022
In the most recent census reports, 67% of White families are homeowners compared to only 44% of Black families.
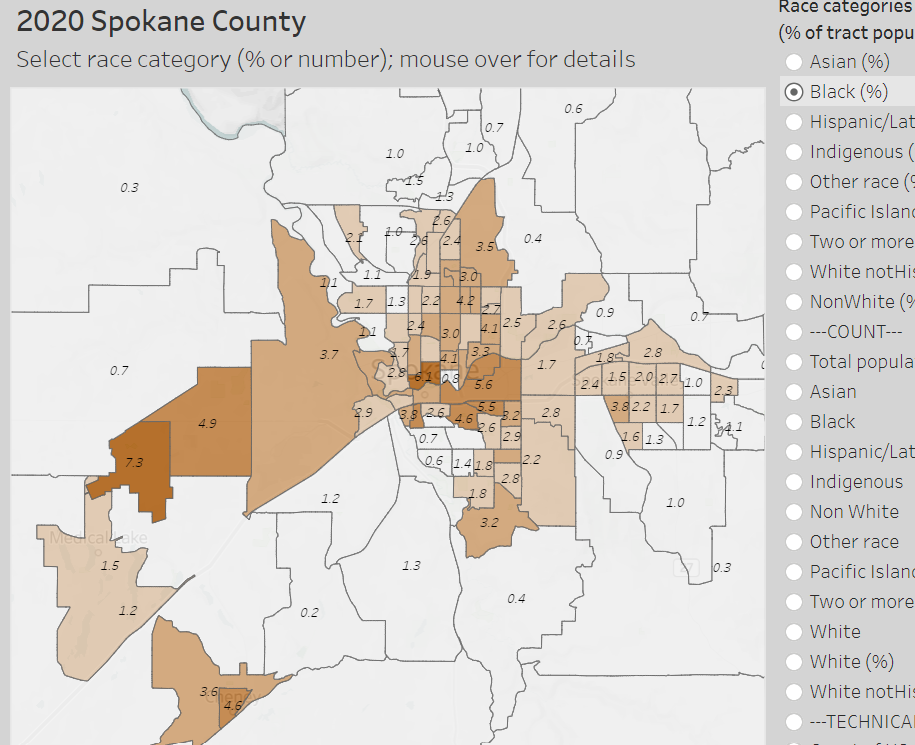
Race and segregation maps
1960-2020
Here we map the neighborhood-by-neighborhood distributions of African Americans, Asian Americans, Indigenous Americans, Latinos, and Whites across six decades.