Restrictive covenants were one of the reasons that across many generations people of color found it difficult to live in Snohomish County. The 1970 census counted only 1,012 Black residents, 143 of them inmates or staff in Monroe Prison. Asian Americans numbered only 937, while 2,105 Indigenous Americans remained on or near the county's two reservations. Overall, the county population of 265,236 was 98.3% white. These numbers speak to something other than racial segregation. Exclusion was the issue. And its history plays out today in homeownership rates, family wealth, and other effects of exclusion and inequality.
The links below lead to five resources featuring different kinds of maps, lists, and information showing the neighborhoods impacted by racial restrictive covenants and the history of segregation and exclusion.
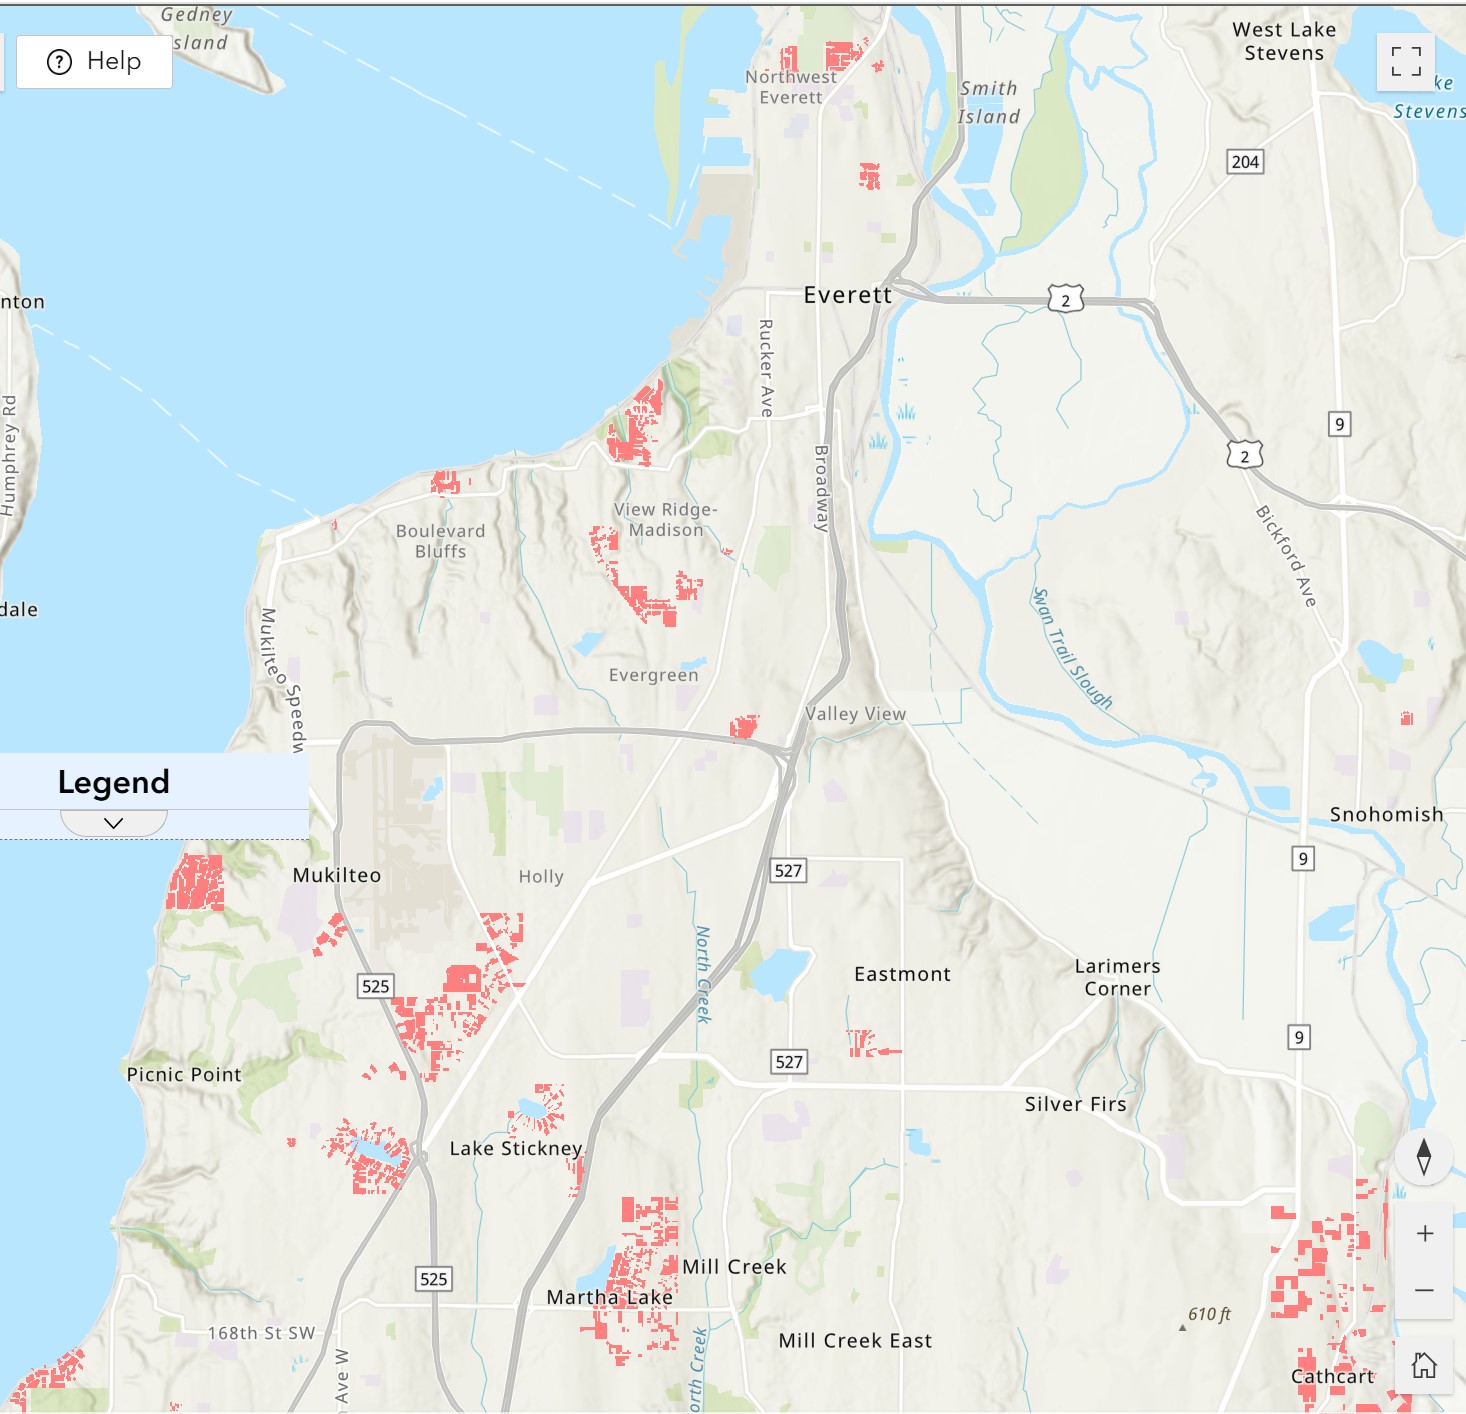
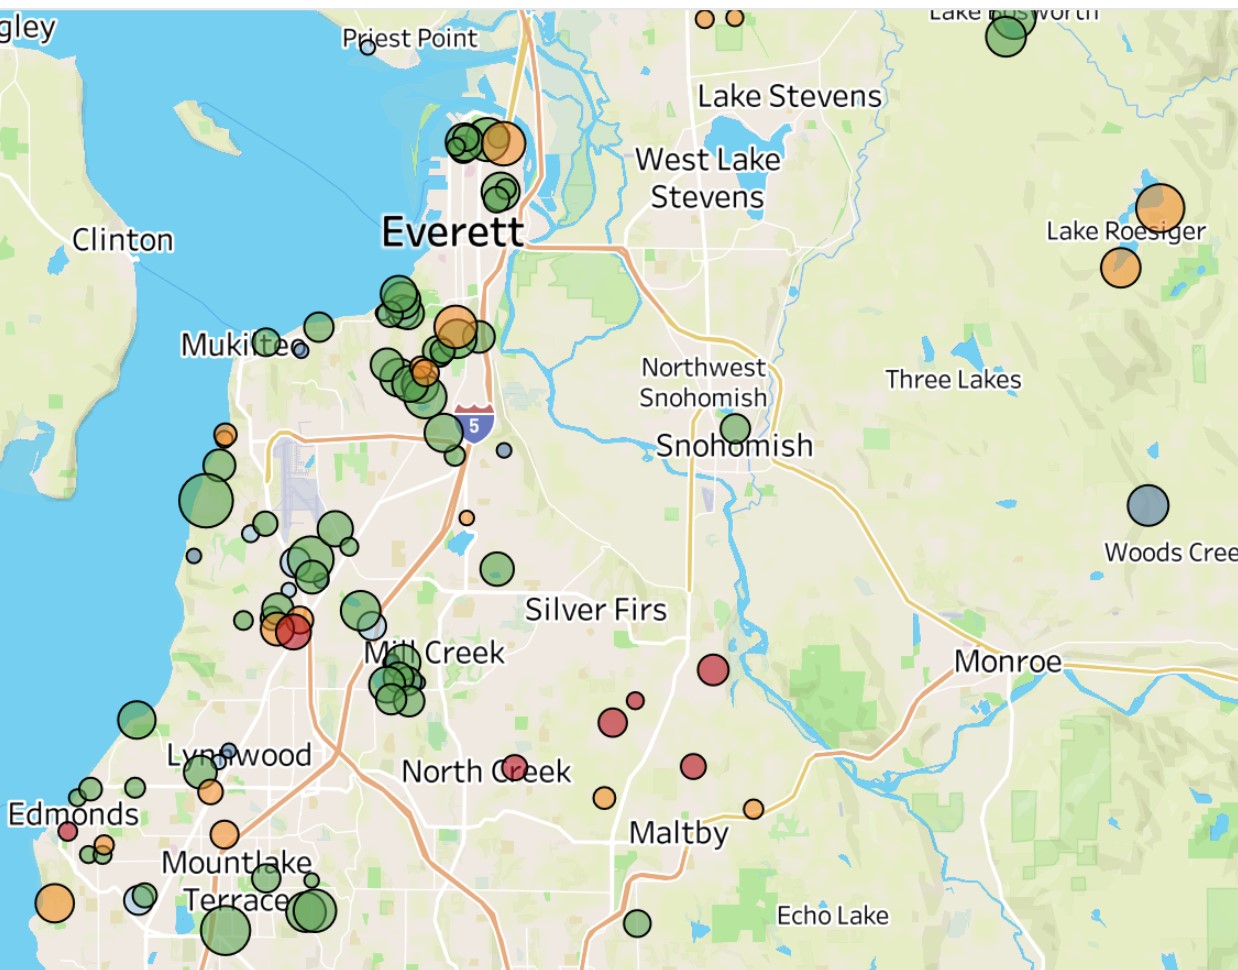
6,972 restricted parcels
Interactive map shows the exact location of nearly 7,000 properties that carried racial restrictions. Zoom to see addresses and restriction language.
Snohomish History of Racial Exclusion, Segregation, Housing
Narrates the history of racial exclusion in Snohomish County, charting the legal and social enforcement of racial covenants and the struggles to prohibit them.
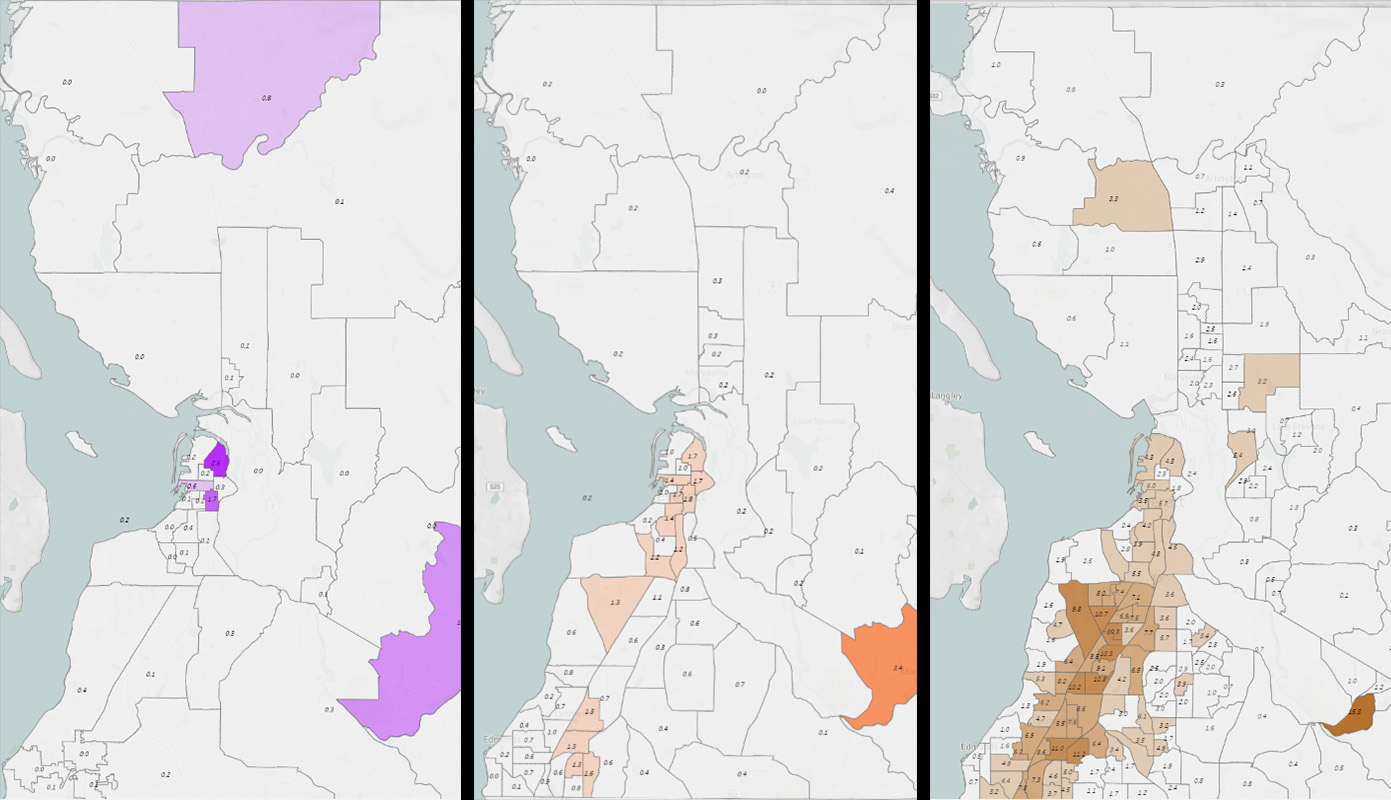
Race and segregation maps
1960-2020
Here we map the neighborhood-by-neighborhood distributions of African Americans, Asian Americans, Indigenous Americans, Latinos, and Whites across six decades.
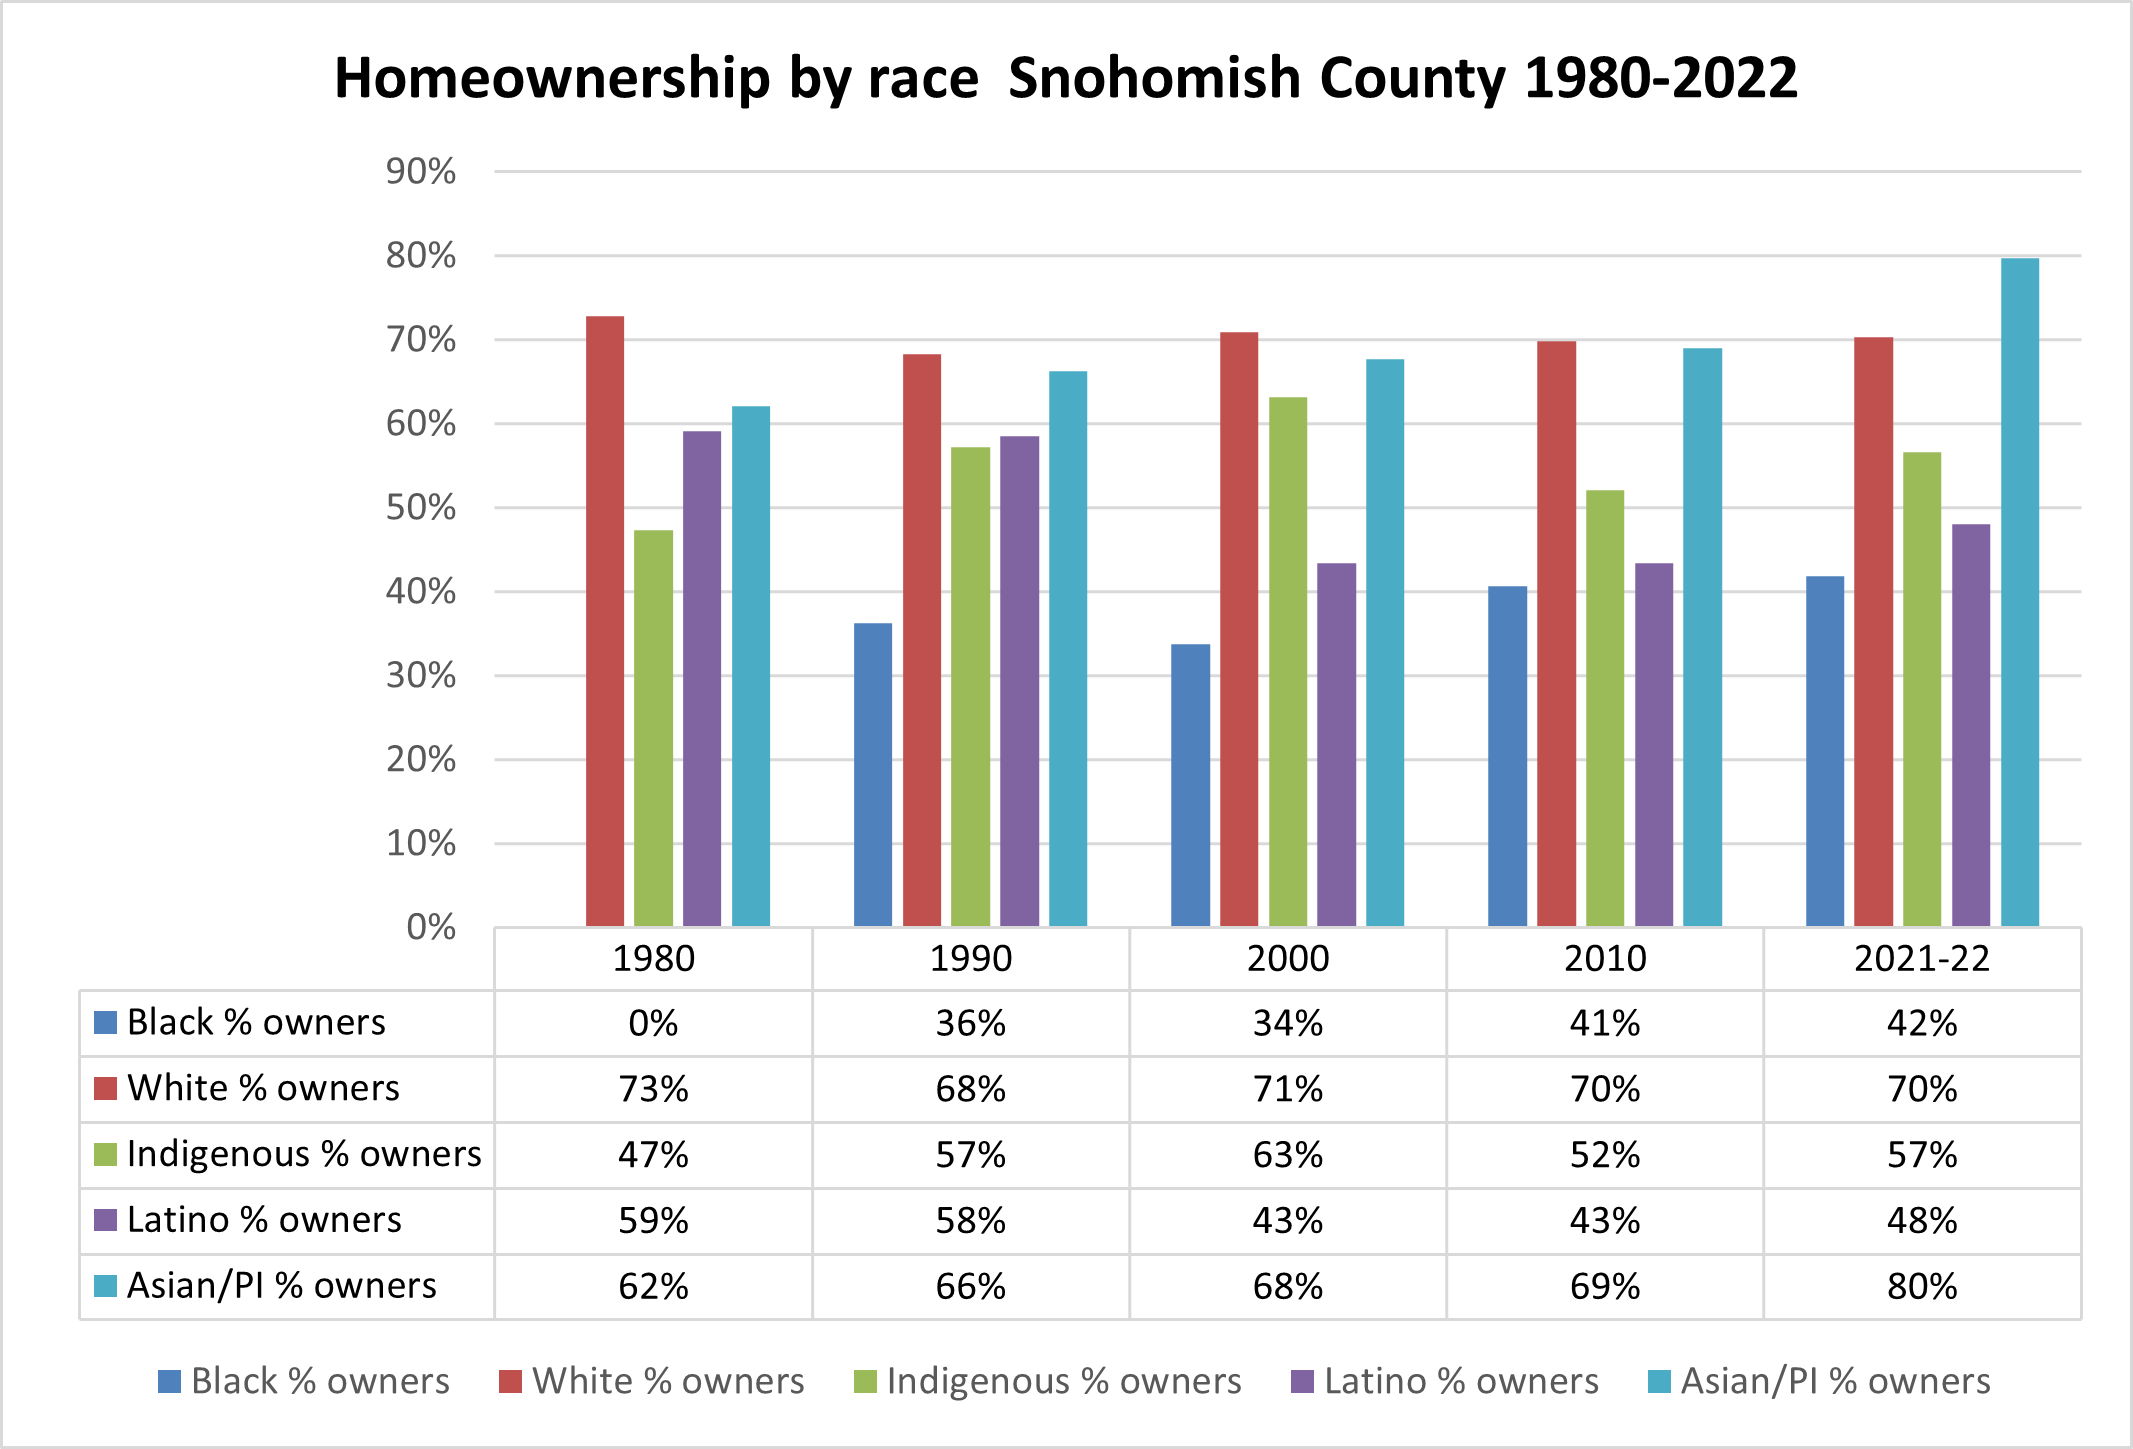
Homeownership by race
1990-2022
In 2022, 70% of White families were homeowners compared to 42% of Black and 48% of Latino families. Here we track homeownership rates since 1980, showing the continuing disparity in access to homeownership.
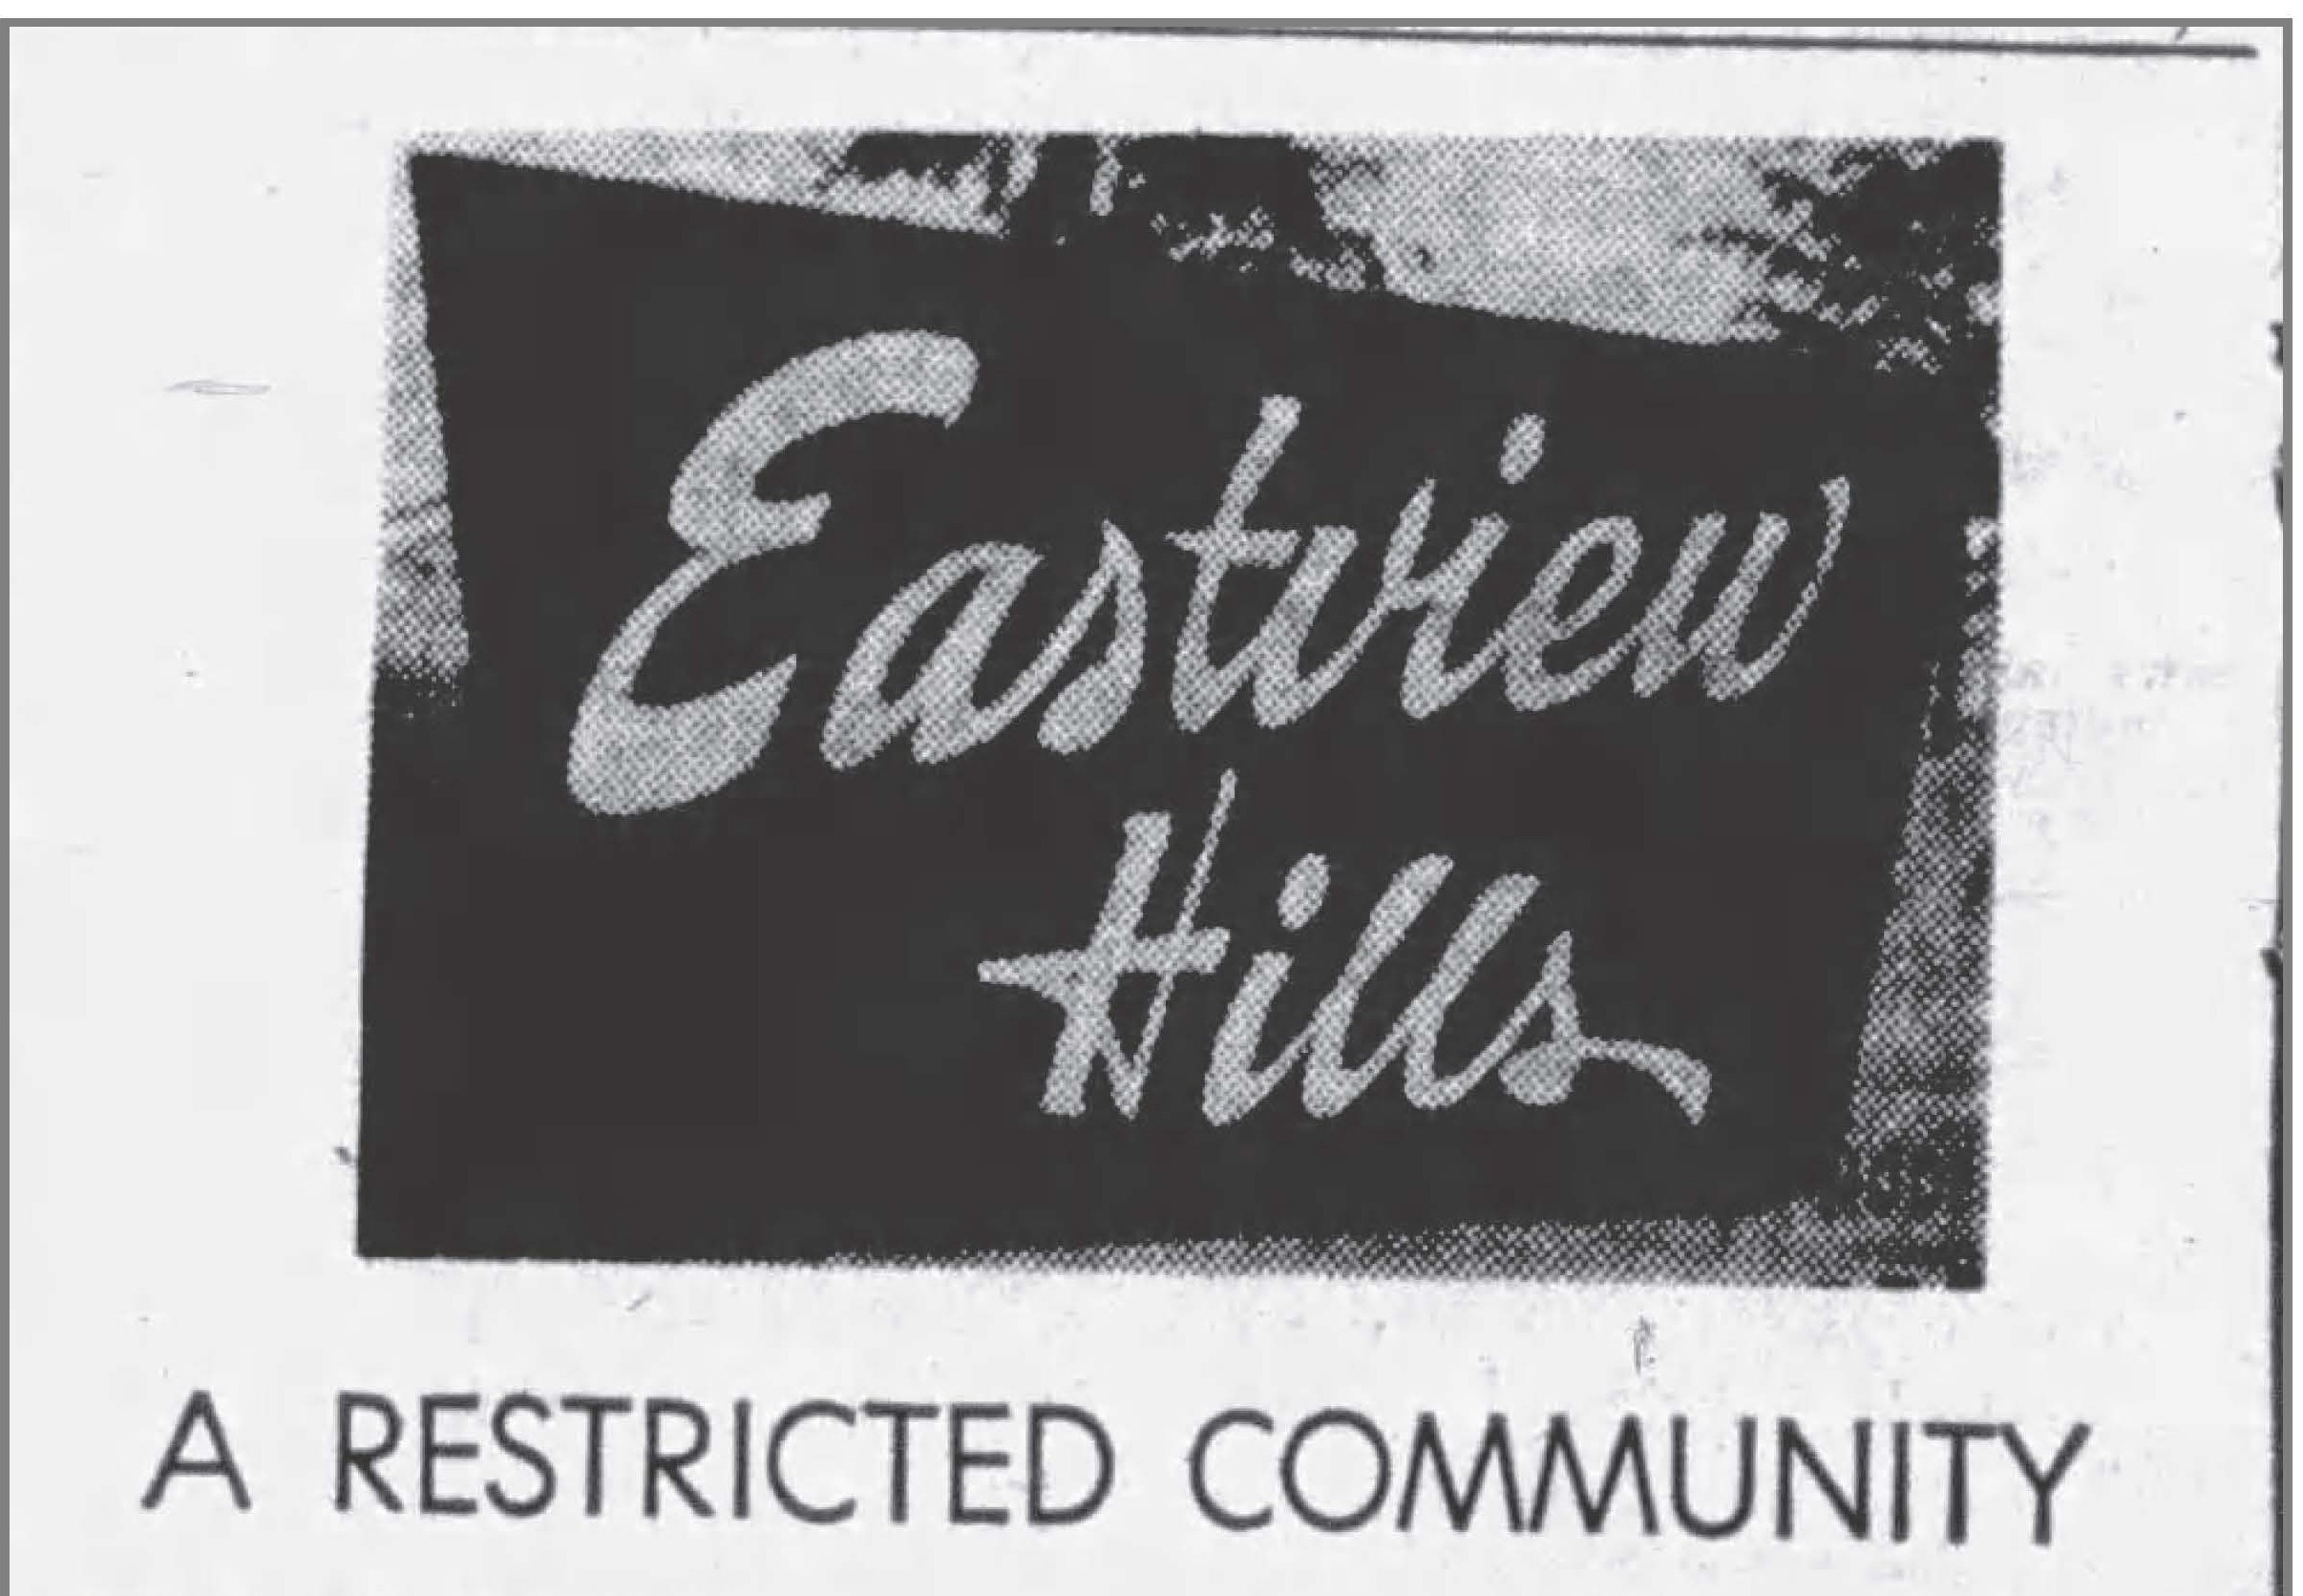
Restricted subdivisions (with documents)
Interactive map shows 124 subdivisons with known restrictions. Scroll the list, read the language of restrictions, learn the names of the developers. Download restrictive documents.