Restrictive covenants were one of the reasons that across many generations people of color found it difficult to live in Whatcom County. The 1970 census counted only 201 Black residents. Asians numbered only 543, while the county remained home to 1,949 Indigenous Americans (mostly Lummi). The county population was 96.7% white. These numbers speak to something other than racial segregation. Exclusion was the issue. And its history plays out today in homeownership rates, family wealth, and other effects of exclusion and inequality.
The links below lead to three resources featuring different kinds of maps, lists, and information showing the neighborhoods impacted by racial restrictive covenants and the history of segregation and exclusion.
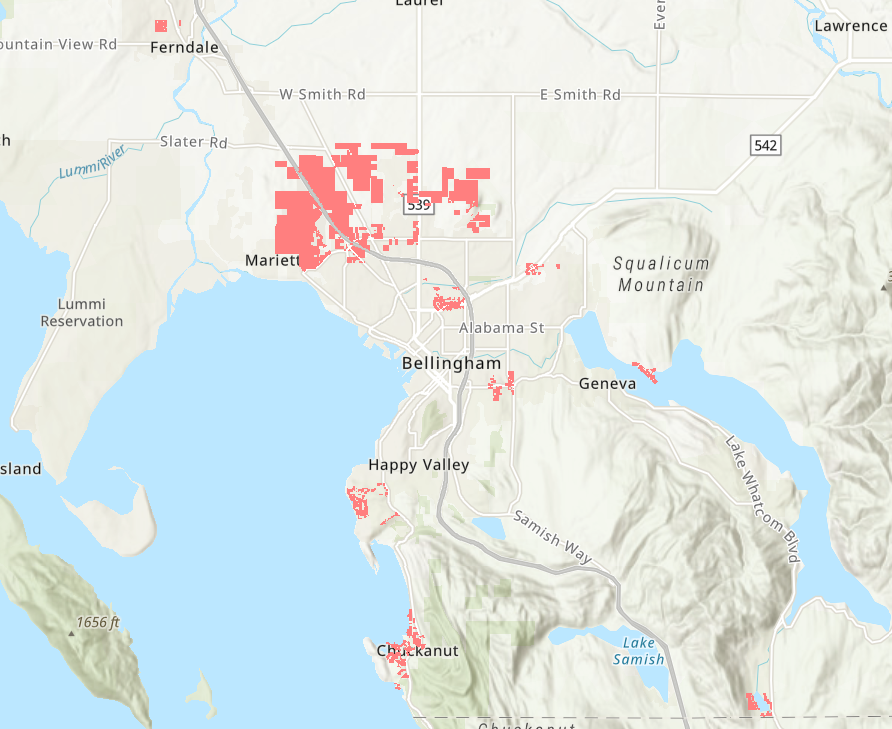
1,600 restricted parcels
This interactive map shows the location and addresses of properties that carried racial restrictions.
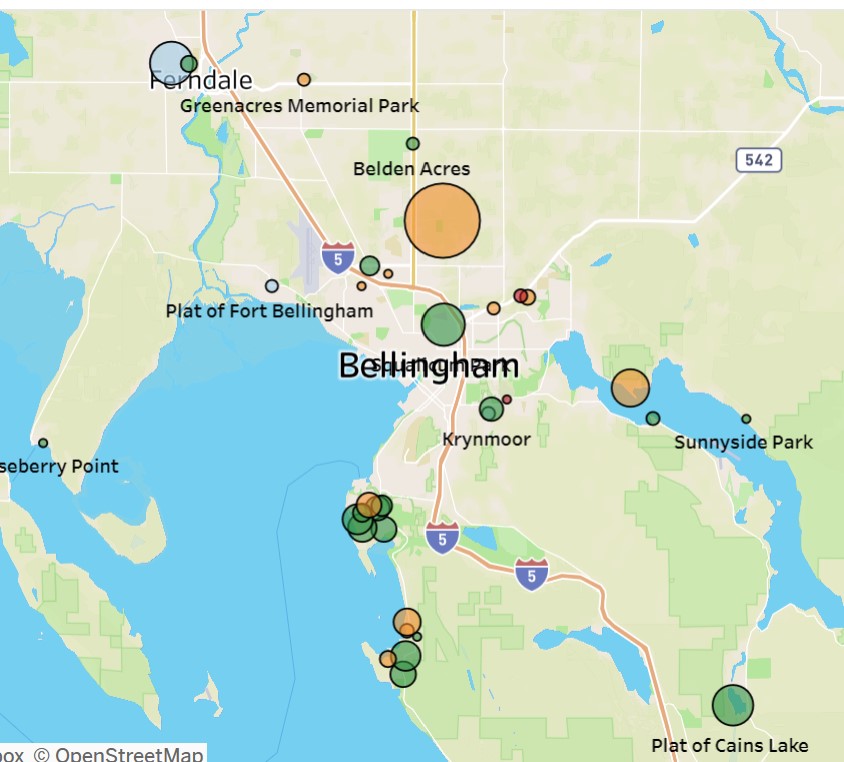
Restricted subdivisions (documents and data)
This map shows 35 subdivisons with known restrictions. Read the language of restrictions, learn the names of the developers.