Home ownership in Washington has followed a disturbing pattern in recent decades. While more than two-thirds of White families are able to own homes, most Black and Latino families do not. And for Black households the trend has gotten worse. In recent census reports the disparity is beyond alarming: 69% of White families are homeowners compared to only 34% of Black families. Fifty years ago, in 1970, 48% of Black families owned homes. Since them it has fallen decade after decade. In some counties the disparities are worse than the state average (only 28% in Seattle/King County; nearly the lowest rate among US big cities). Links below lead to reports that show homeownership rates and home values differentiated by race since 1970 for the state as a whole and key counties. Other charts show that even at comparable income levels, the disparity is dramatic.
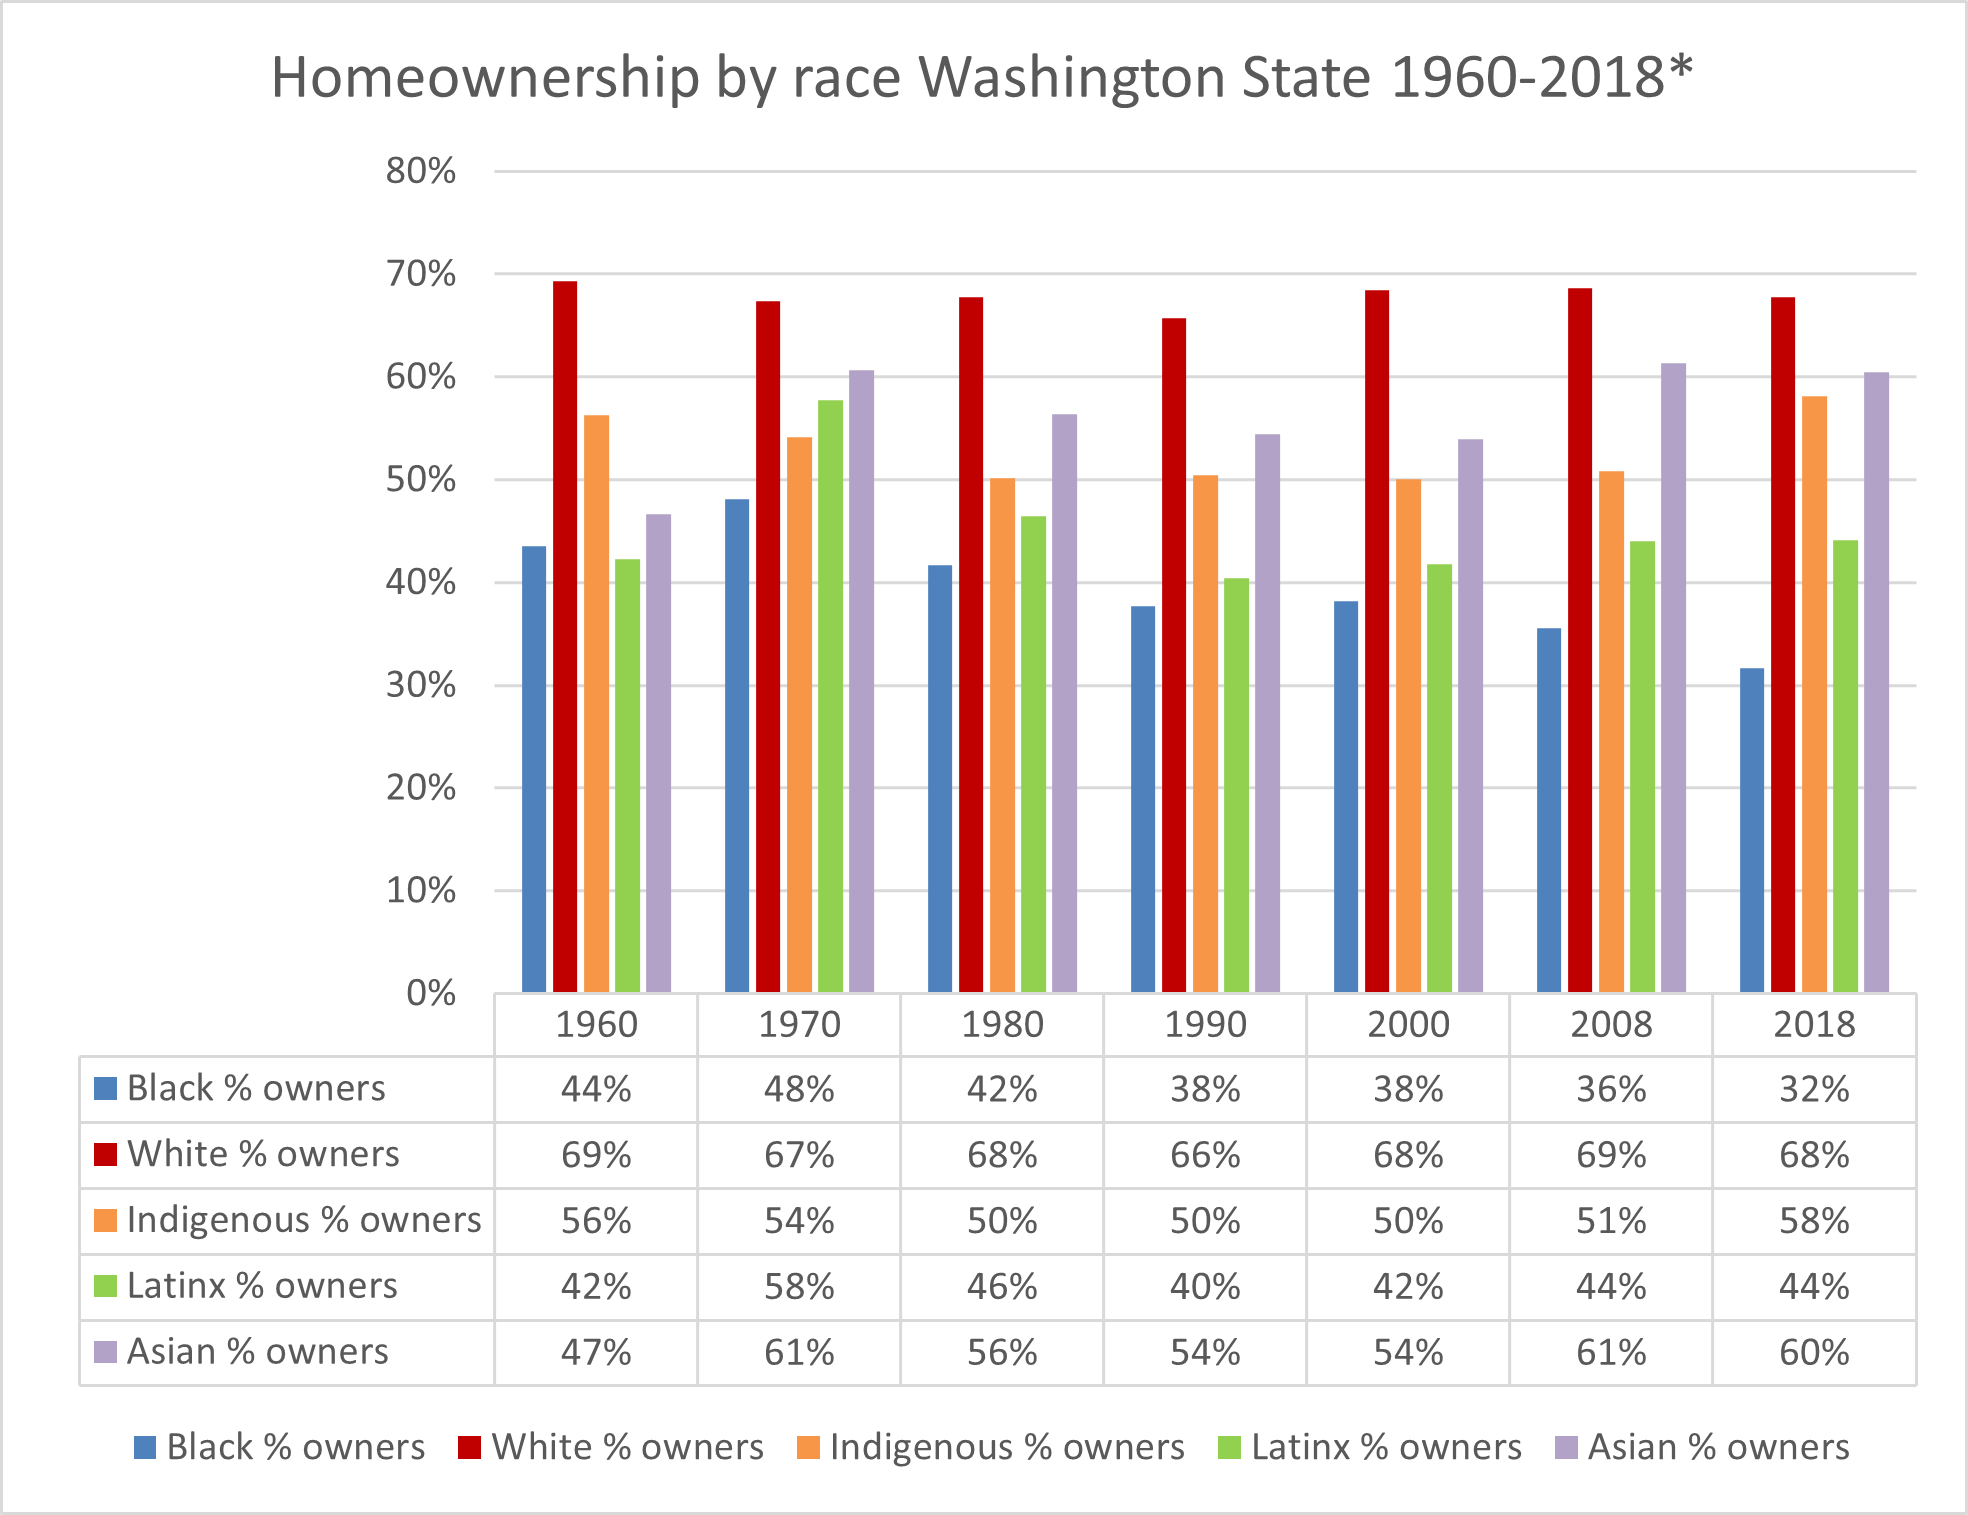
Washington state 1970-2022
While 69% of White families are able to own homes, most Black and Latino families do not.
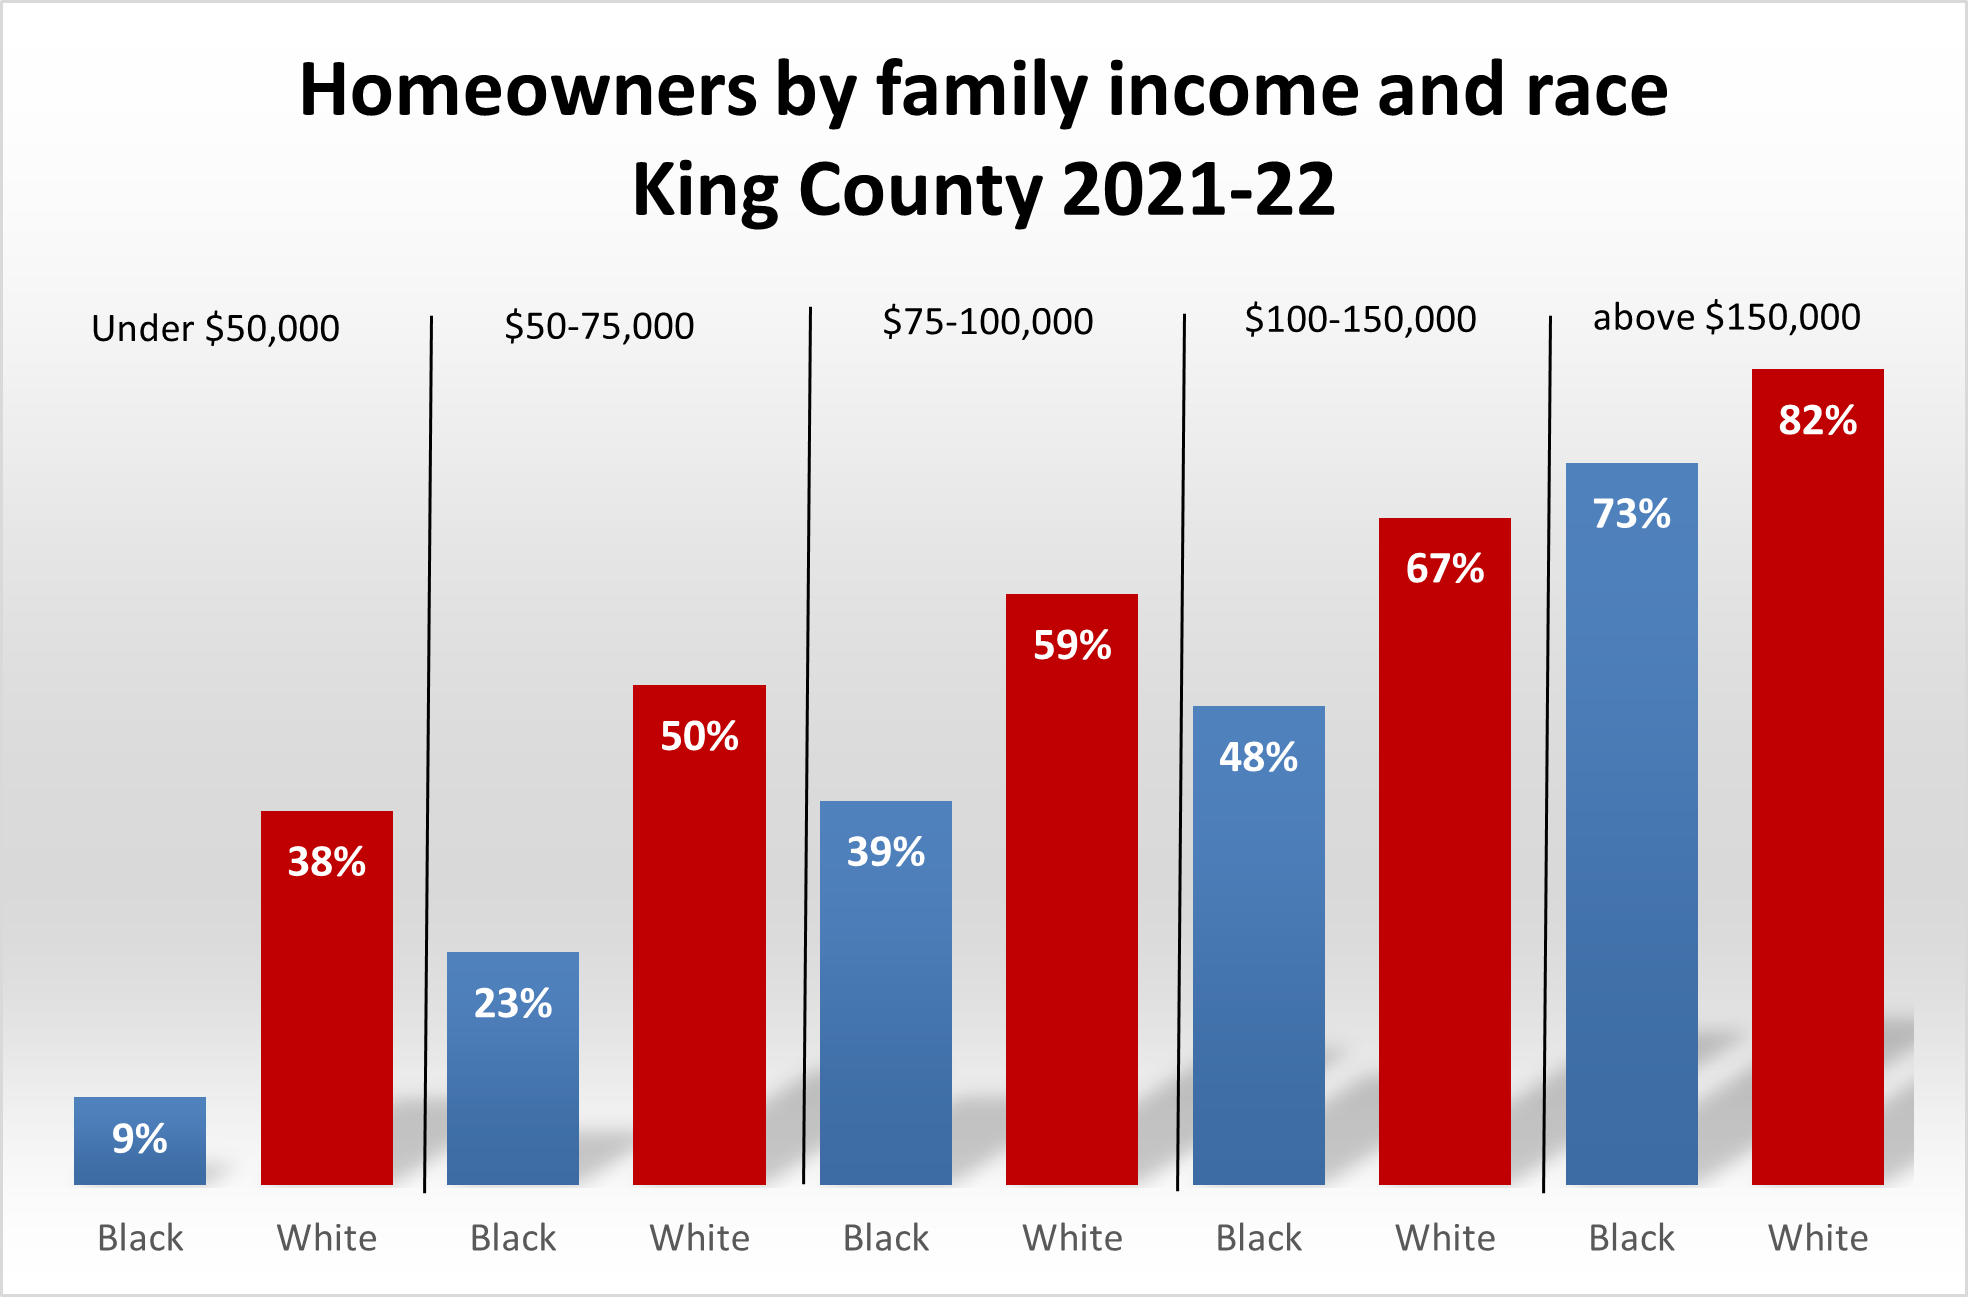
King County
1970-2022
Ownership disparties are more severe in Seattle than in all but one major US city. At every income level, Black families own fewer homes.
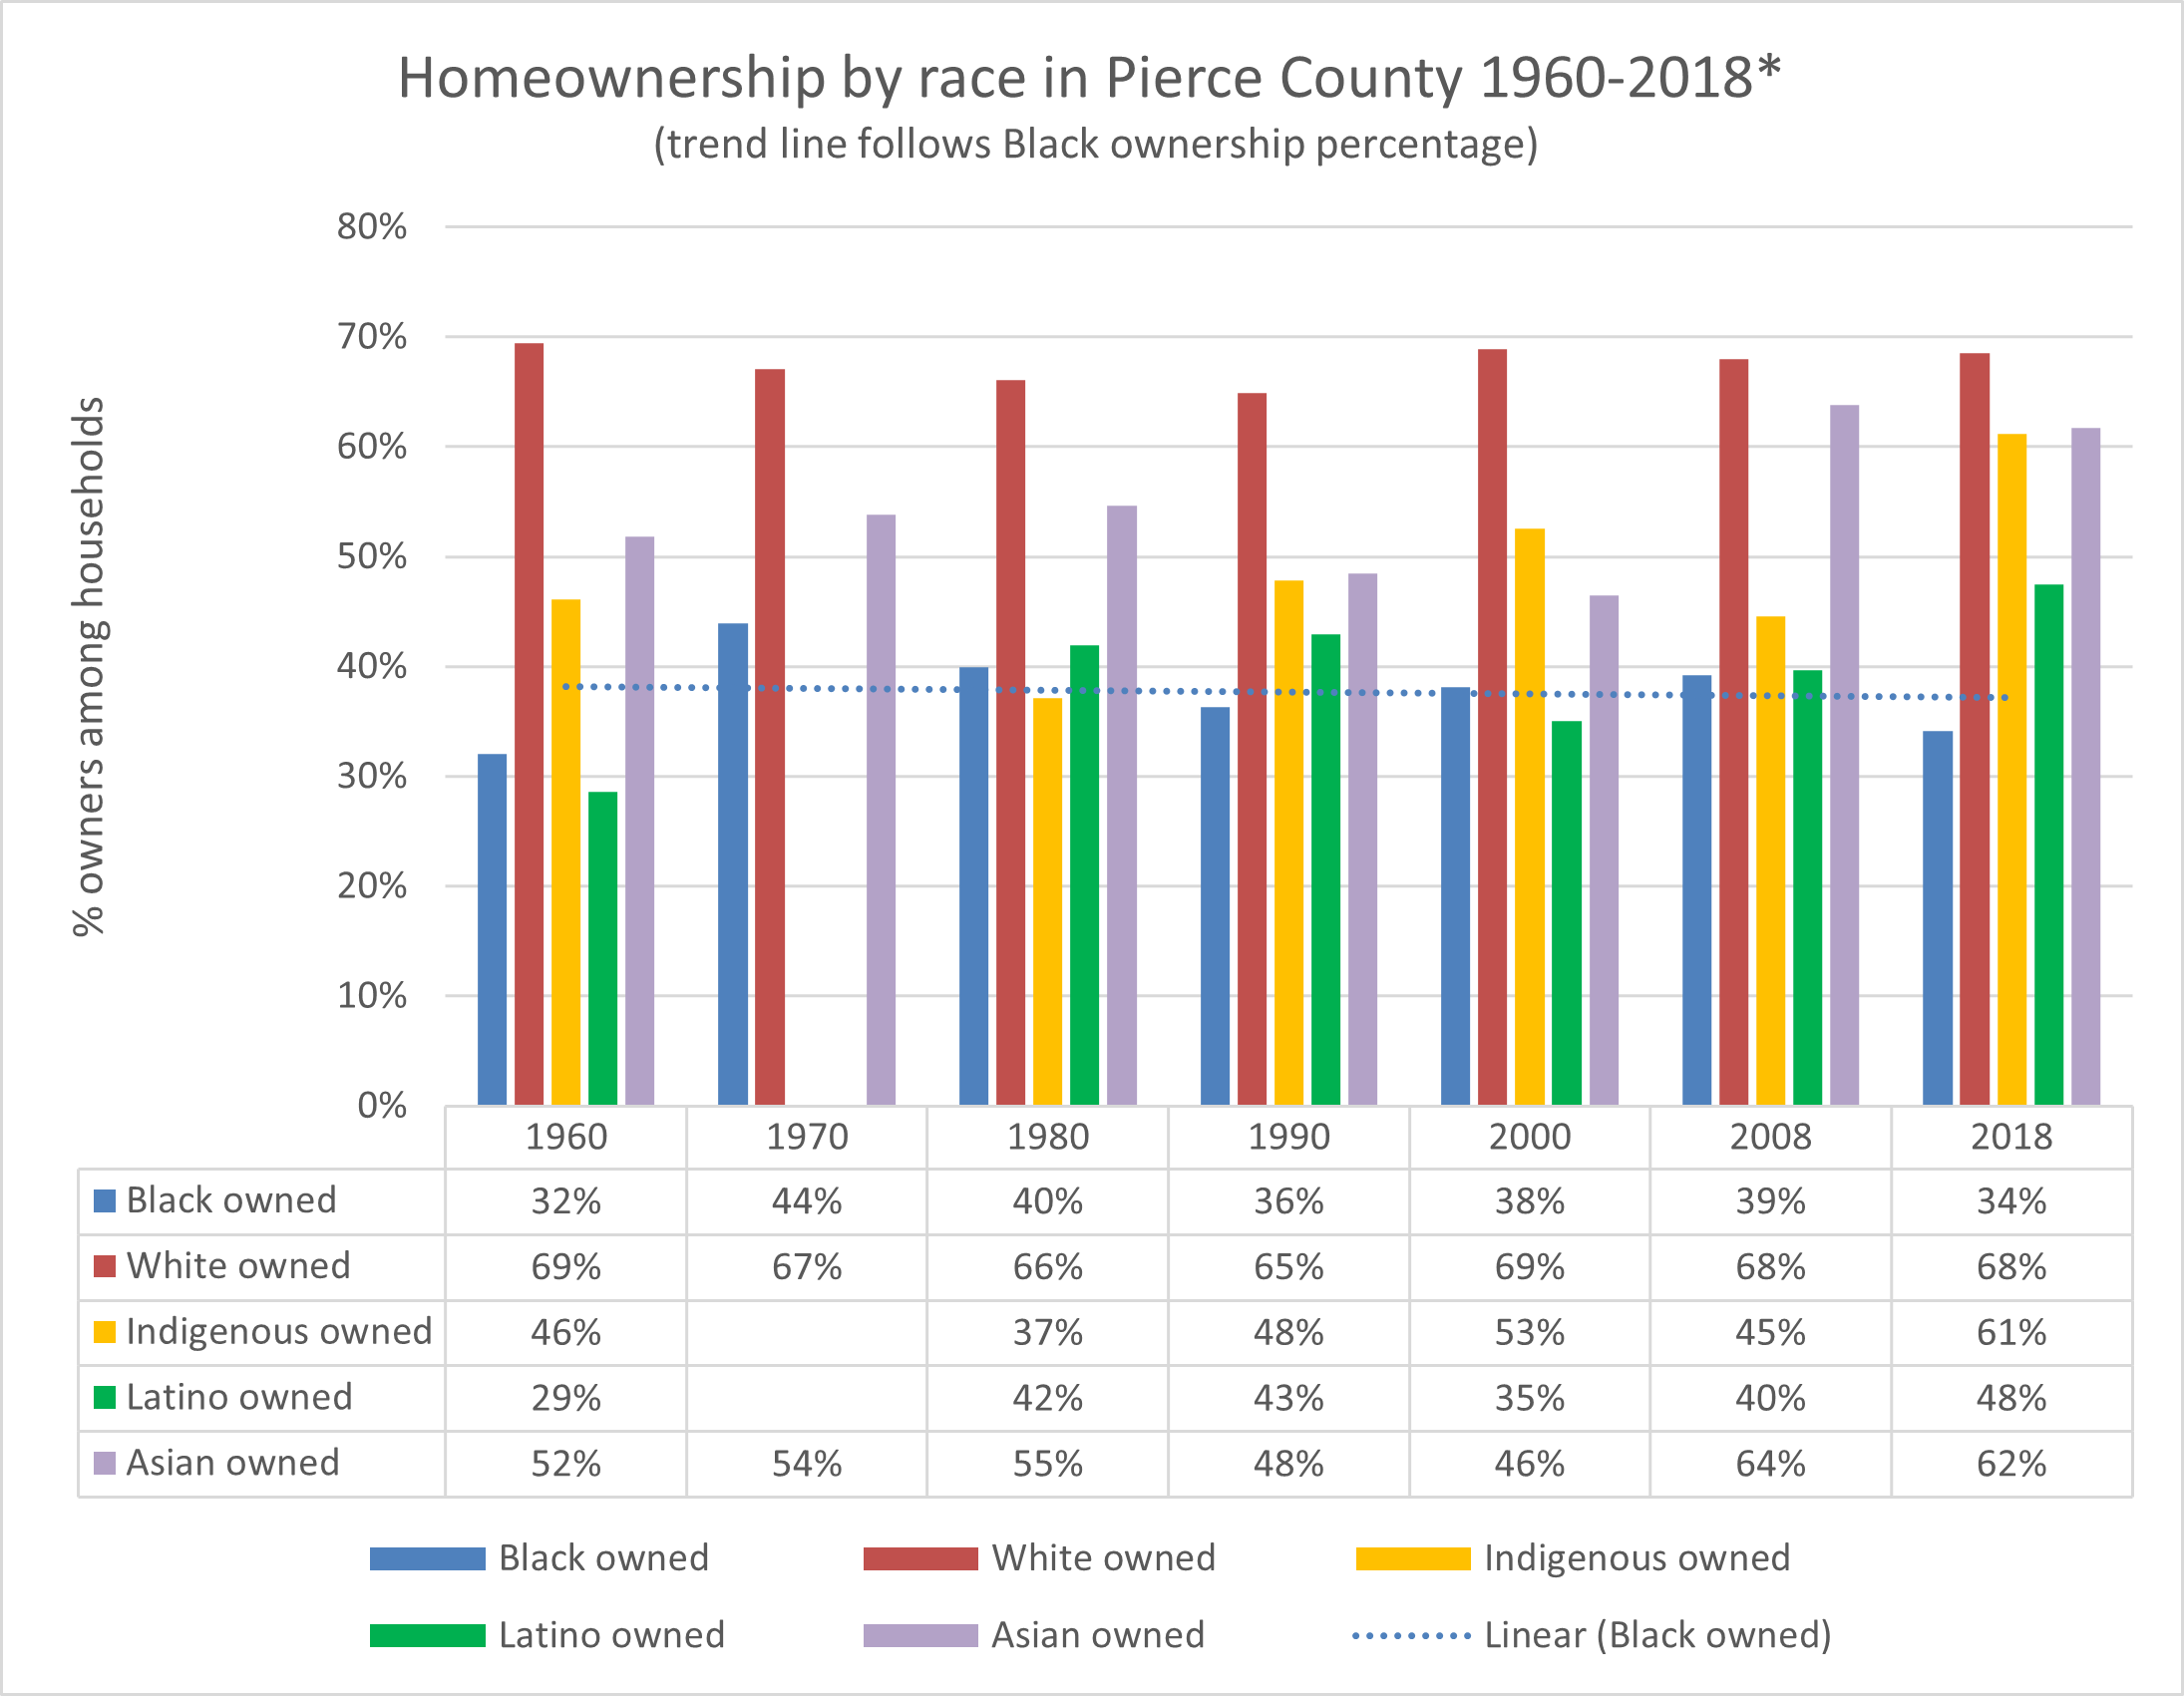
Pierce County
1970-2022
In recent census reports the disparity is beyond alarming: 68% of White families are homeowners compared to only 34% of Black families
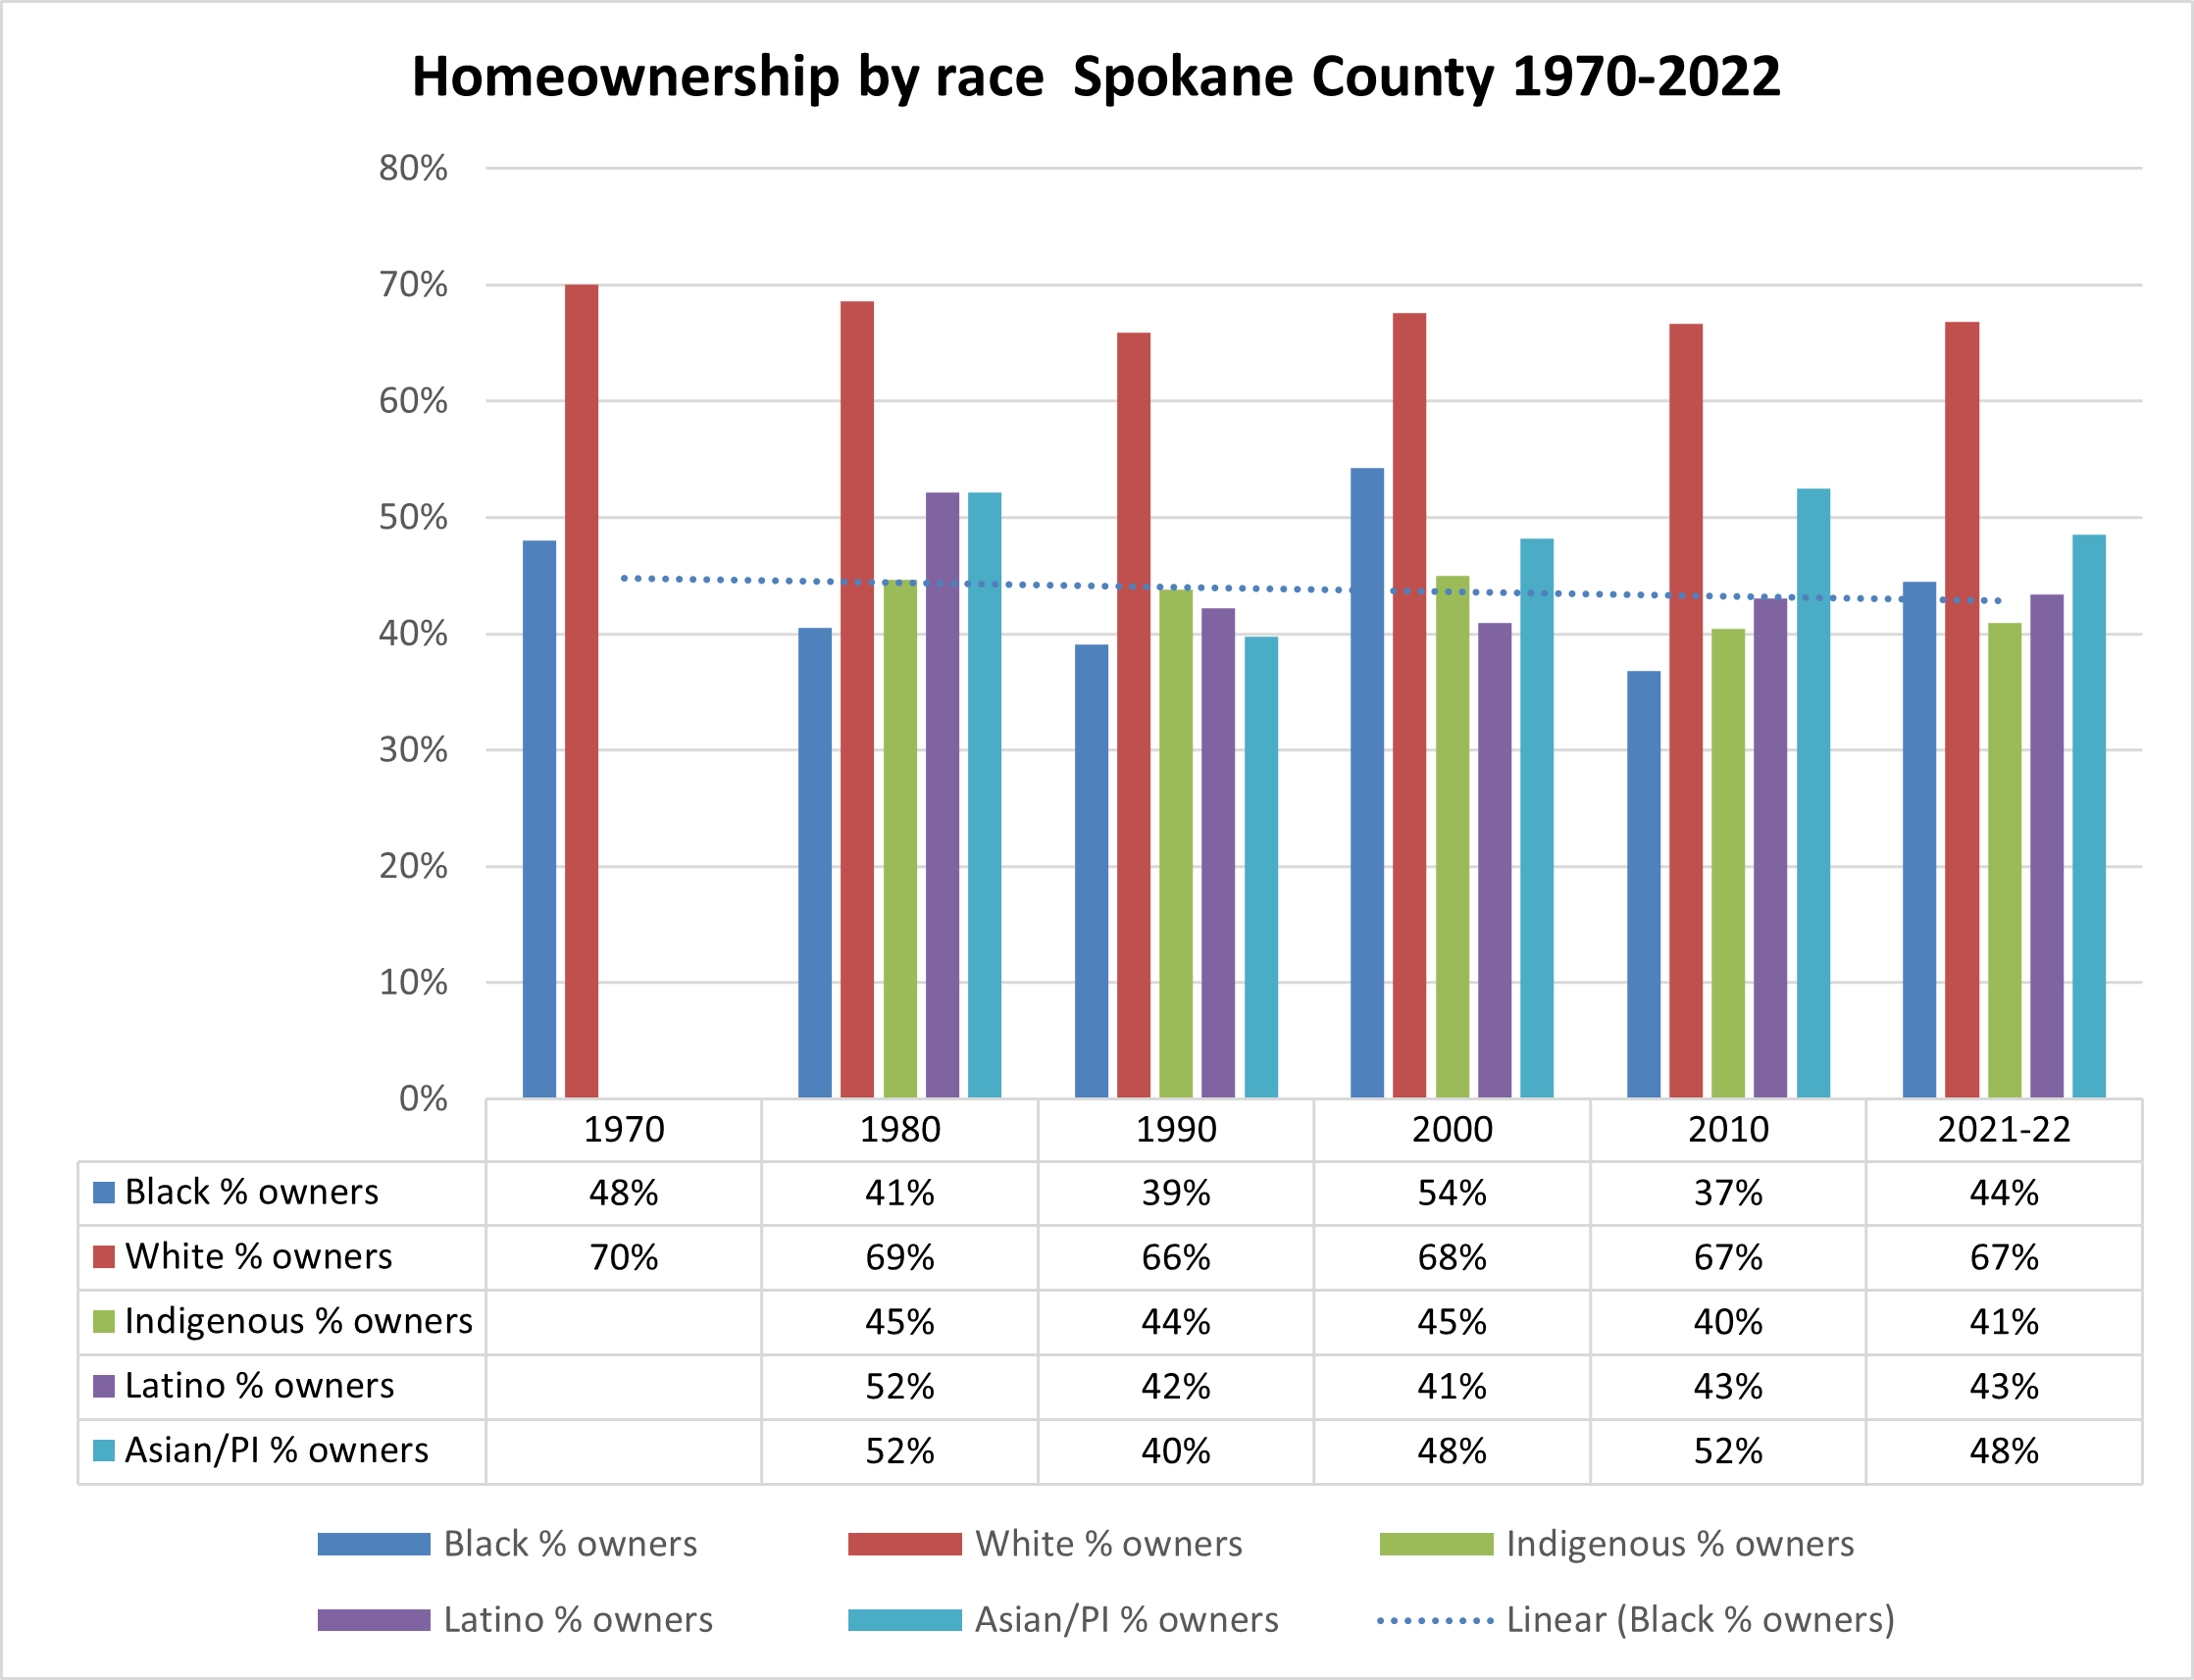
Spokane County
1990-2022
In the most recent census reports, 67% of White families are homeowners compared to only 44% of Black families.
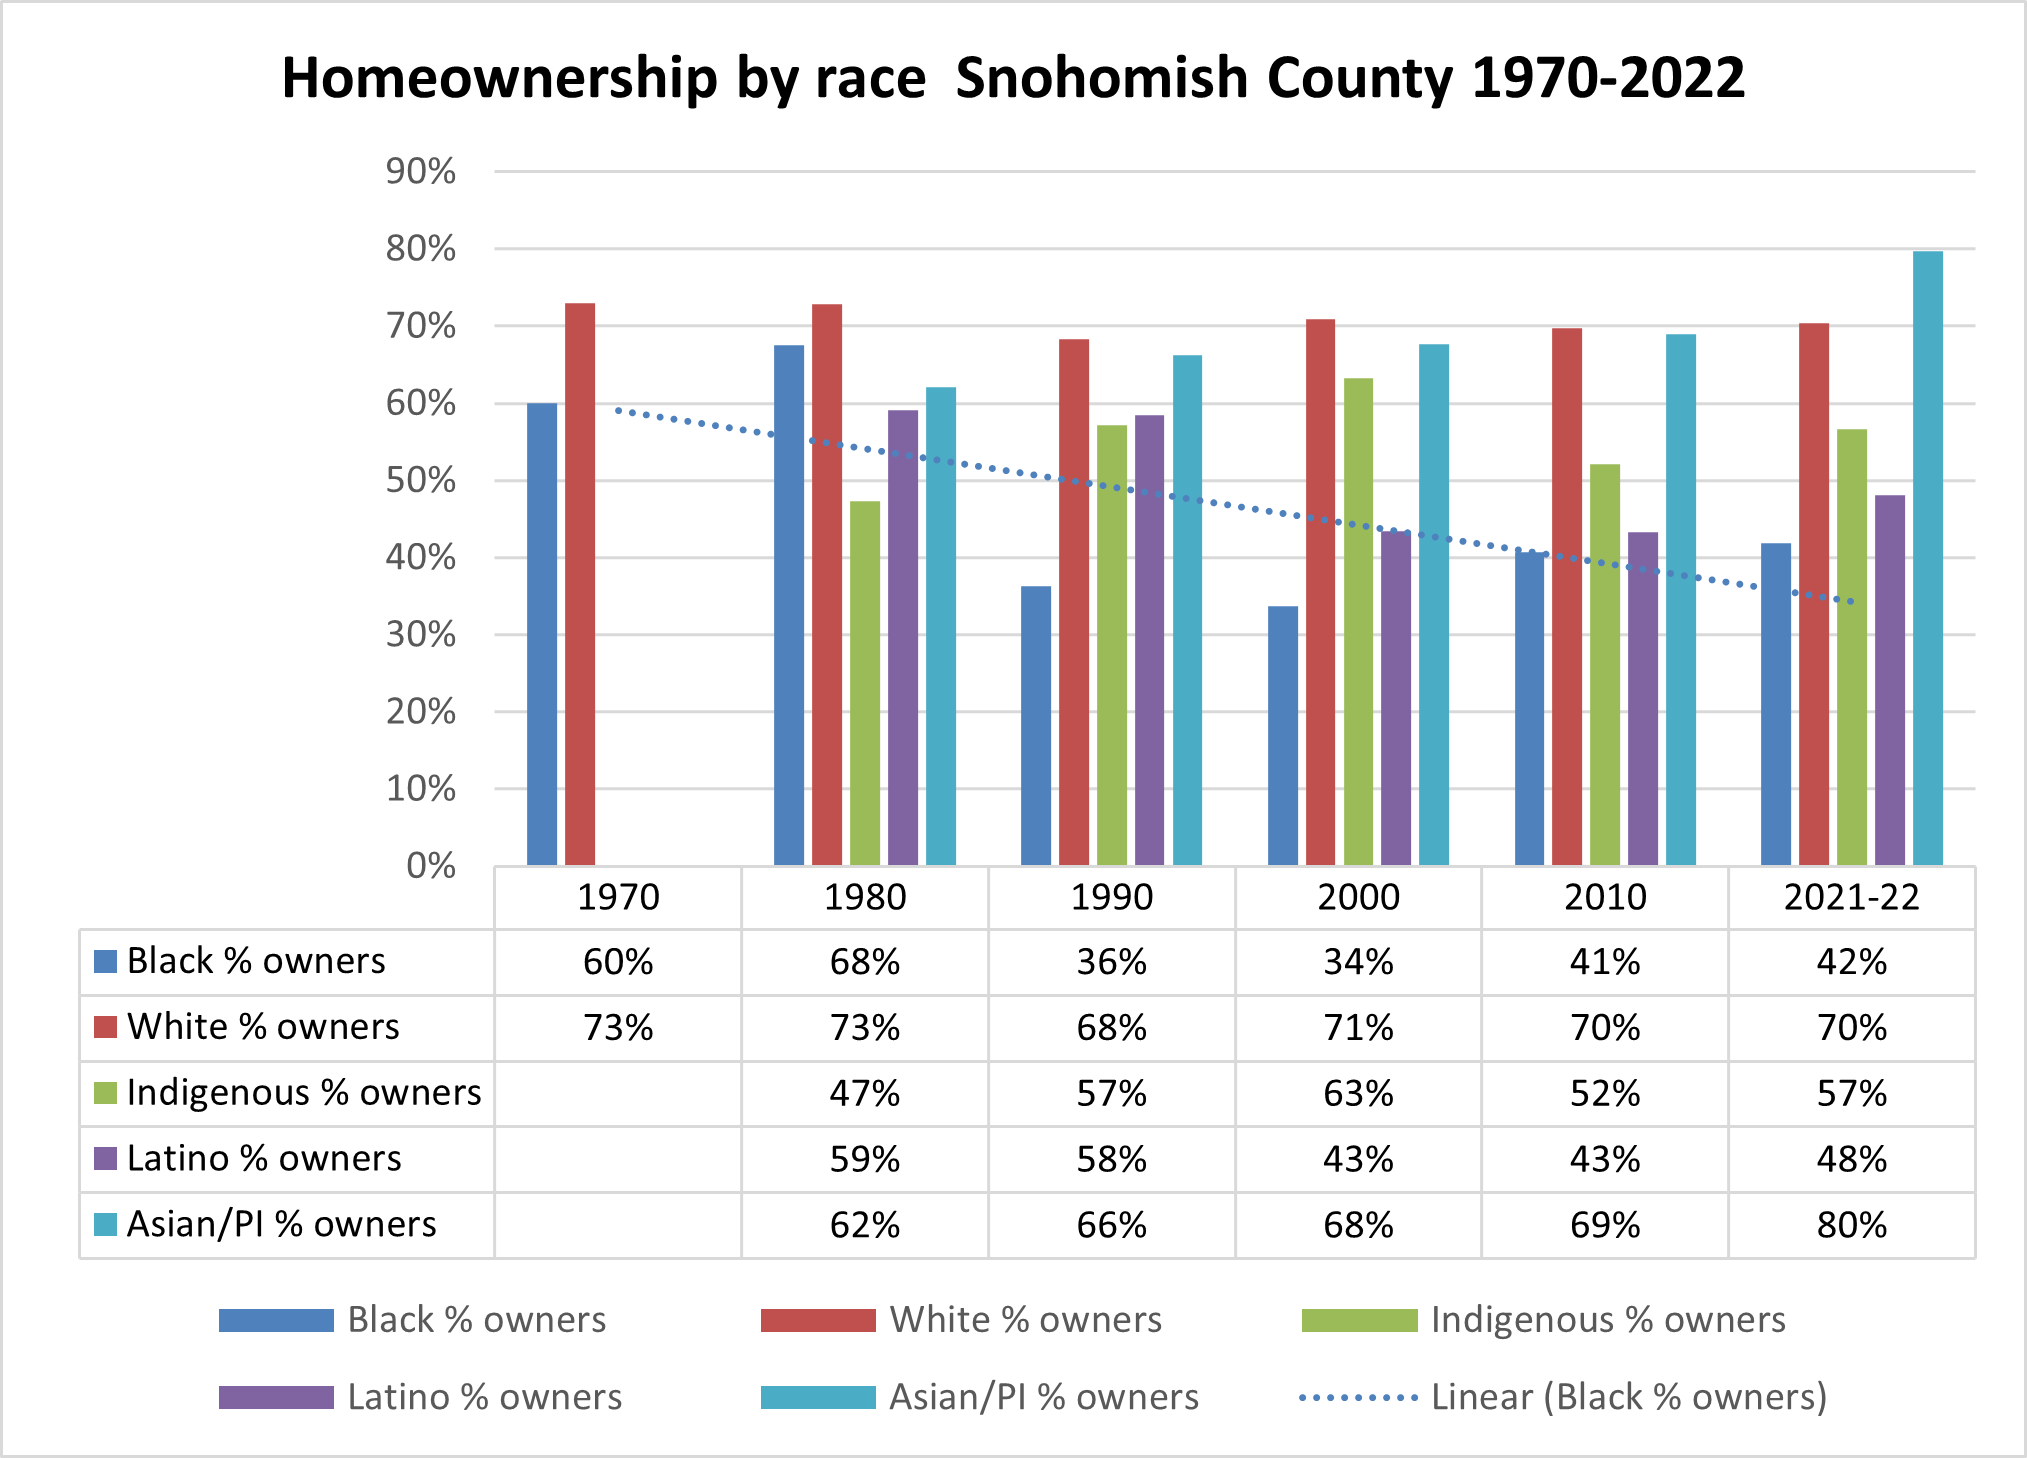
Snohomish County
1990-2022
In the most recent census, 70% of White families are able to own homes, most Black and Latino families do not.
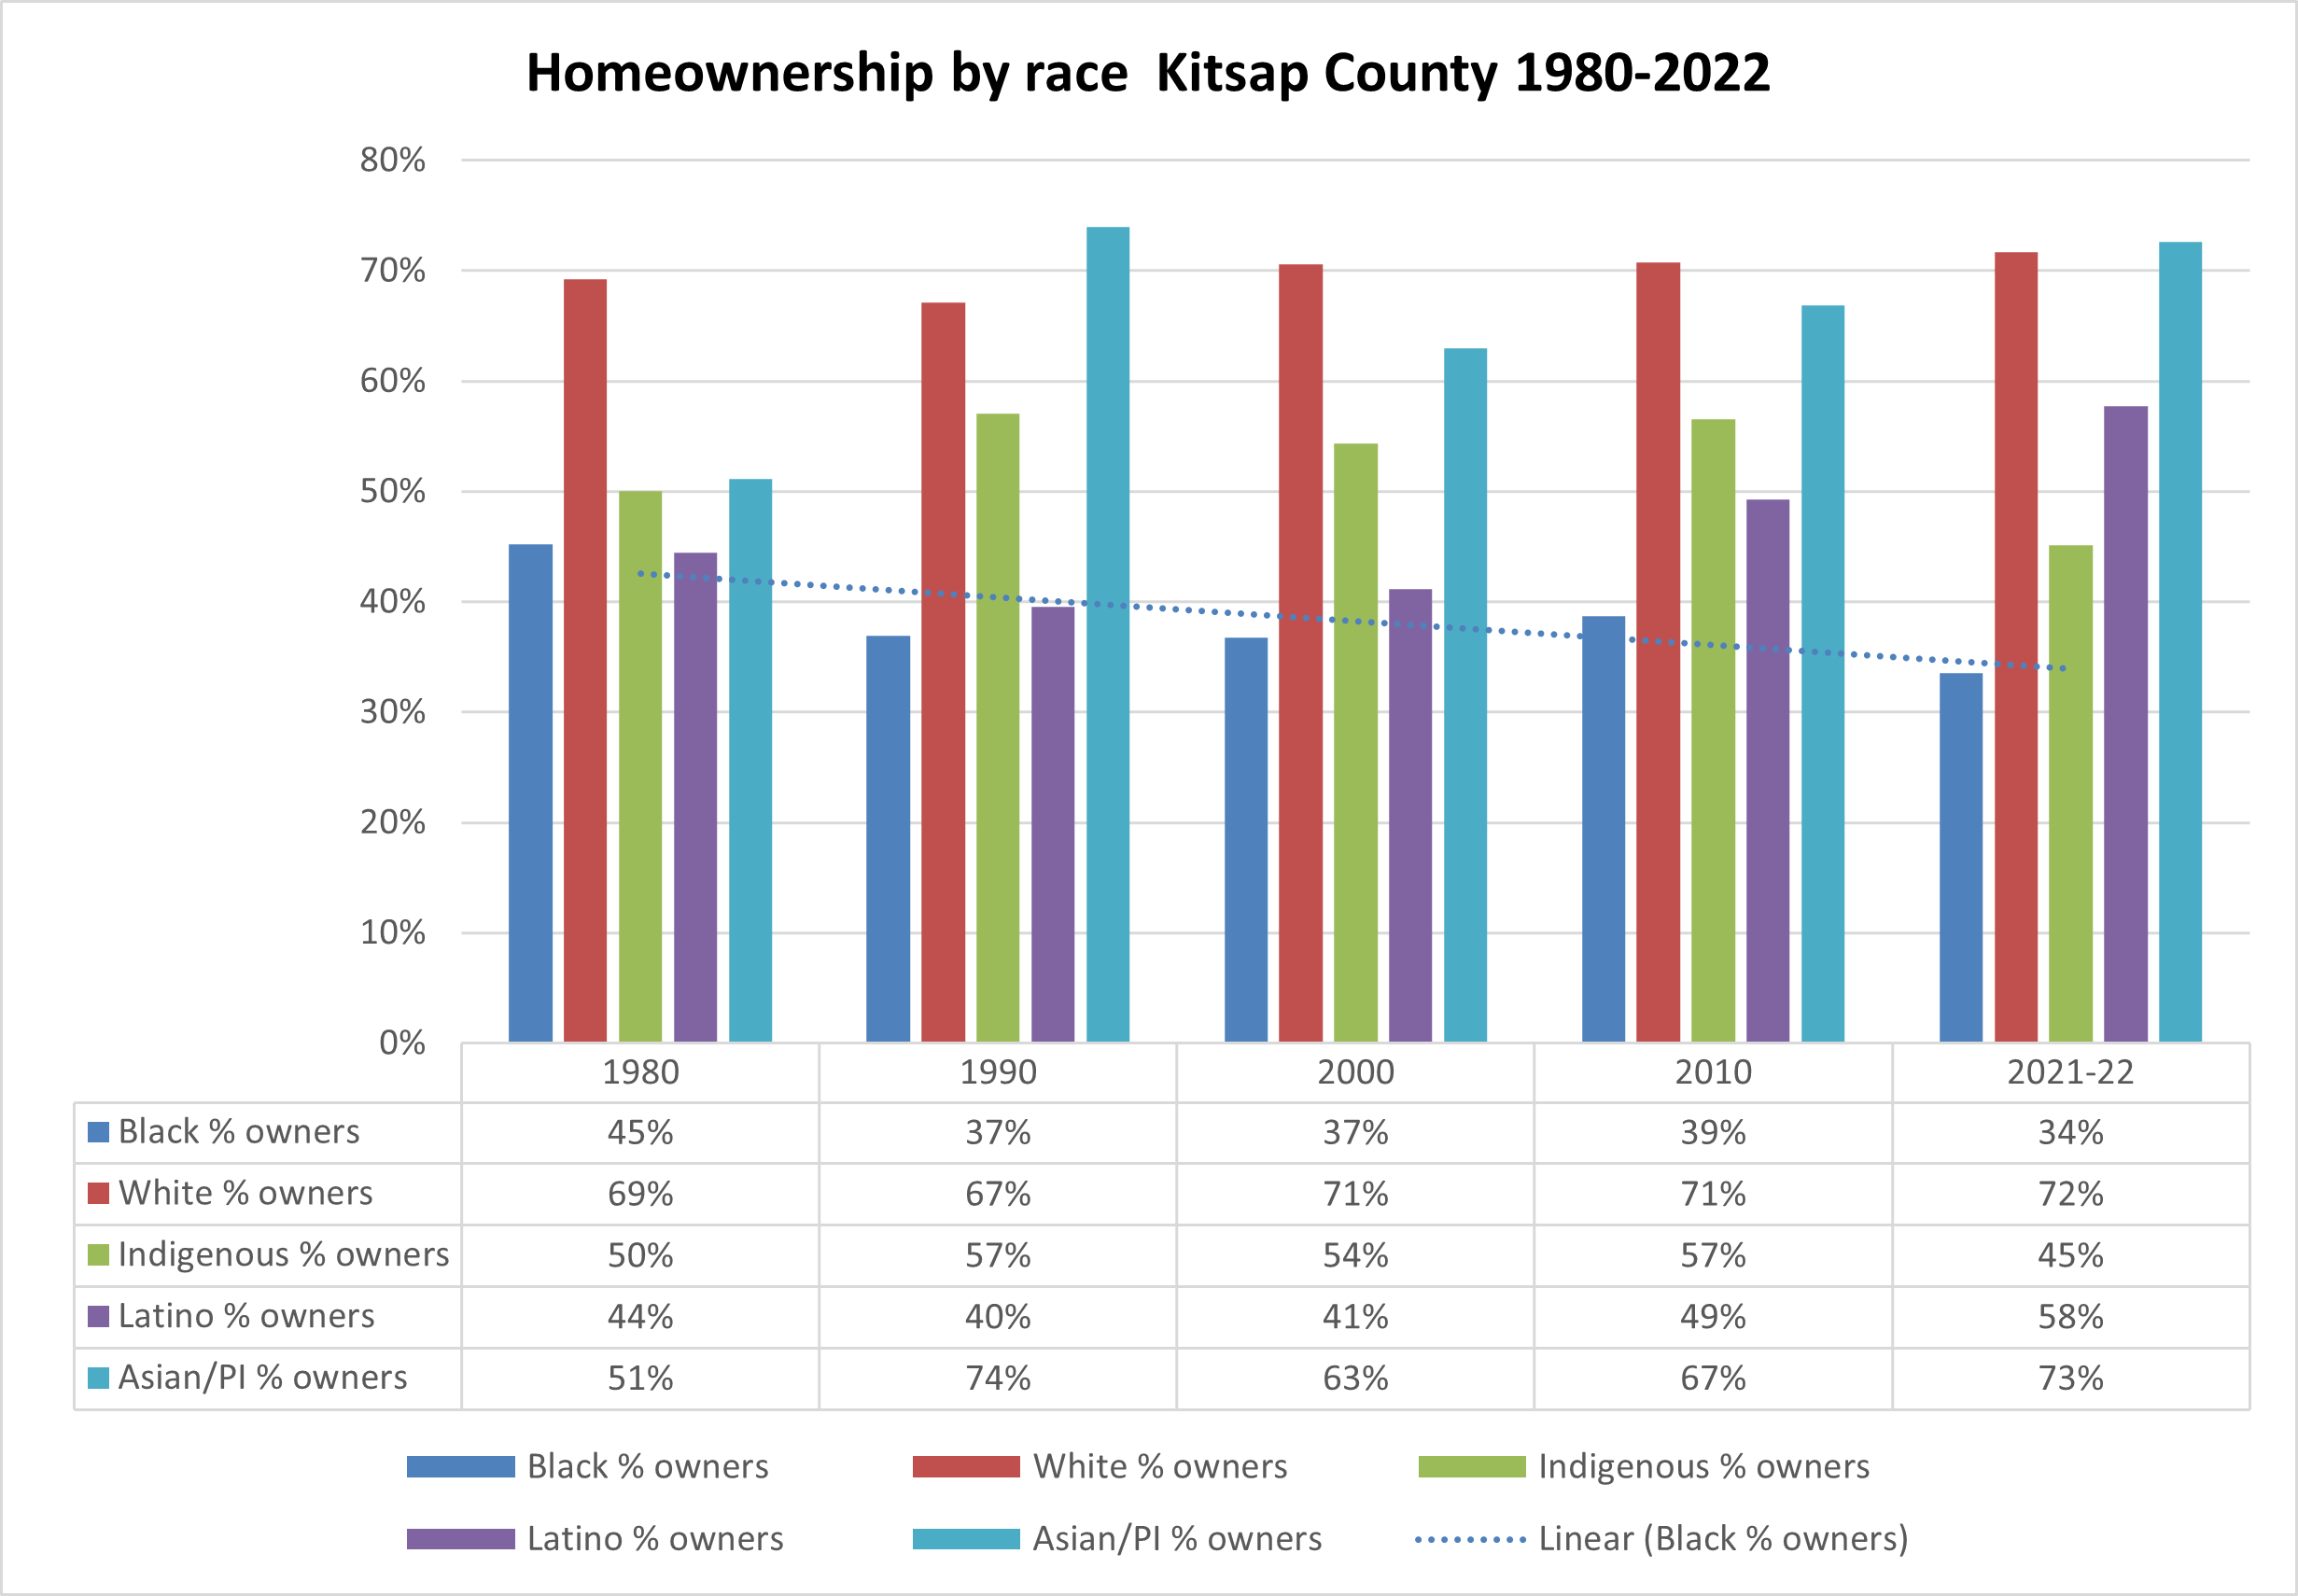
Kitsap County
1980-2022
In the most recent census, 72% of White families are able to own homes, while only 34% of Black families were homeowners.

Thurston County
1990-2022
Home ownership rates for families of color have improved in recent decades but still fall well behind white households.