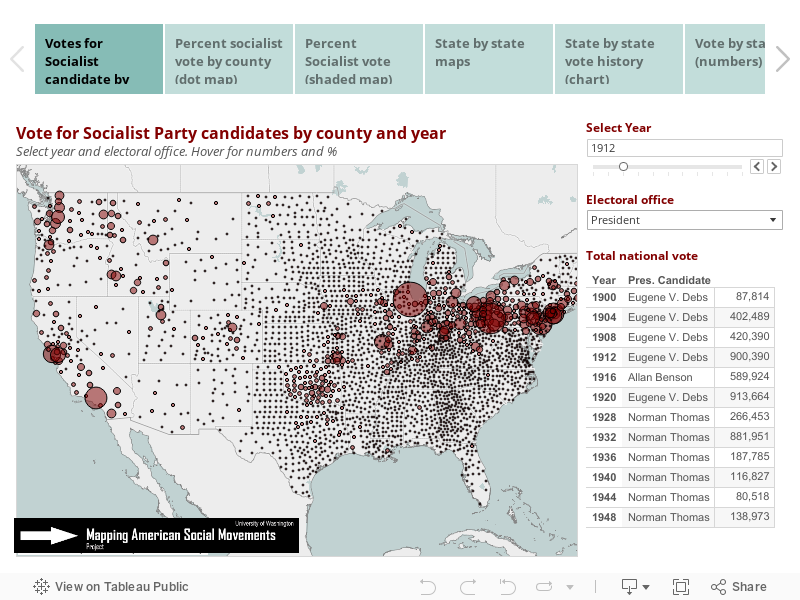
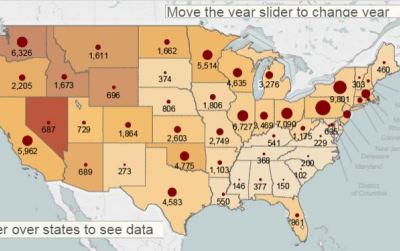
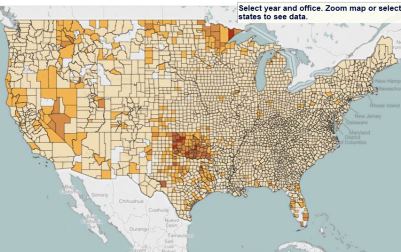
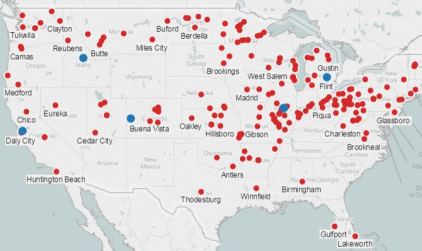
These maps and charts show the number and percentage of votes for Socialist candidates for each state and county. They include presidential, gubernatorial, and congressional elections. The SP secured over 900,000 votes in 1912 and large totals in other races as late as 1938. These maps show the shifting geography of support. Sources are explained below. The maps are hosted by Tableau Public and may take a few seconds to respond. If slow, refresh the page. Here are other Socialist Party maps.
Move between six maps and charts by selecting tabs below
Sources:
Vote charts and maps are based on data from Inter-university Consortium for Political and Social Research. United States Historical Election Returns, 1824-1968 [Computer File]. ICPSR00001-v3. Ann Arbor, MI: Inter-university Consortium for Political and Social Research [distributor], 1999-04-26. http://doi.org/10.3886/ICPSR00001.v3.
This combination of interactive maps and charts track Socialist Party membership by state during the party's heyday from 1904 to 1919 and then from 1923 to 1940. Party membership reached a high of 113,000 in 1912. Advance the slide to see changing membership by year. Interactive controls allow you to compare particular states.
The SP secured over a million votes for congressional candidates in 1912 and large totals in other races as late as 1938. Here are seven maps and charts showing vote totals for Socialist Party candidates in each presidential, gubernatorial, and congressional election for each county and state.
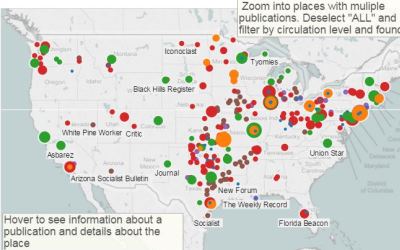
This interactive map identifies 380 newspapers linked to the Socialist Party, providing detail about editors, circulation, and about the towns and cities where they were published.
This interactive map shows 353 cities and towns that elected Socialist Party candidates to public office, including mayors, congressmen, legislators, and many other offices, more than 1,000 in all.
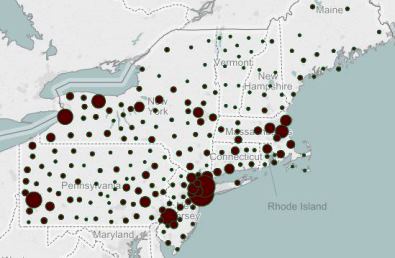
These maps and charts zero in on regions and subregions, displaying county by county electoral support for socialist candidates for the Northeast, Midwest, Northwest, Southwest, and subregions of the South. They make it possible to follow hotspots of party support from election to election.