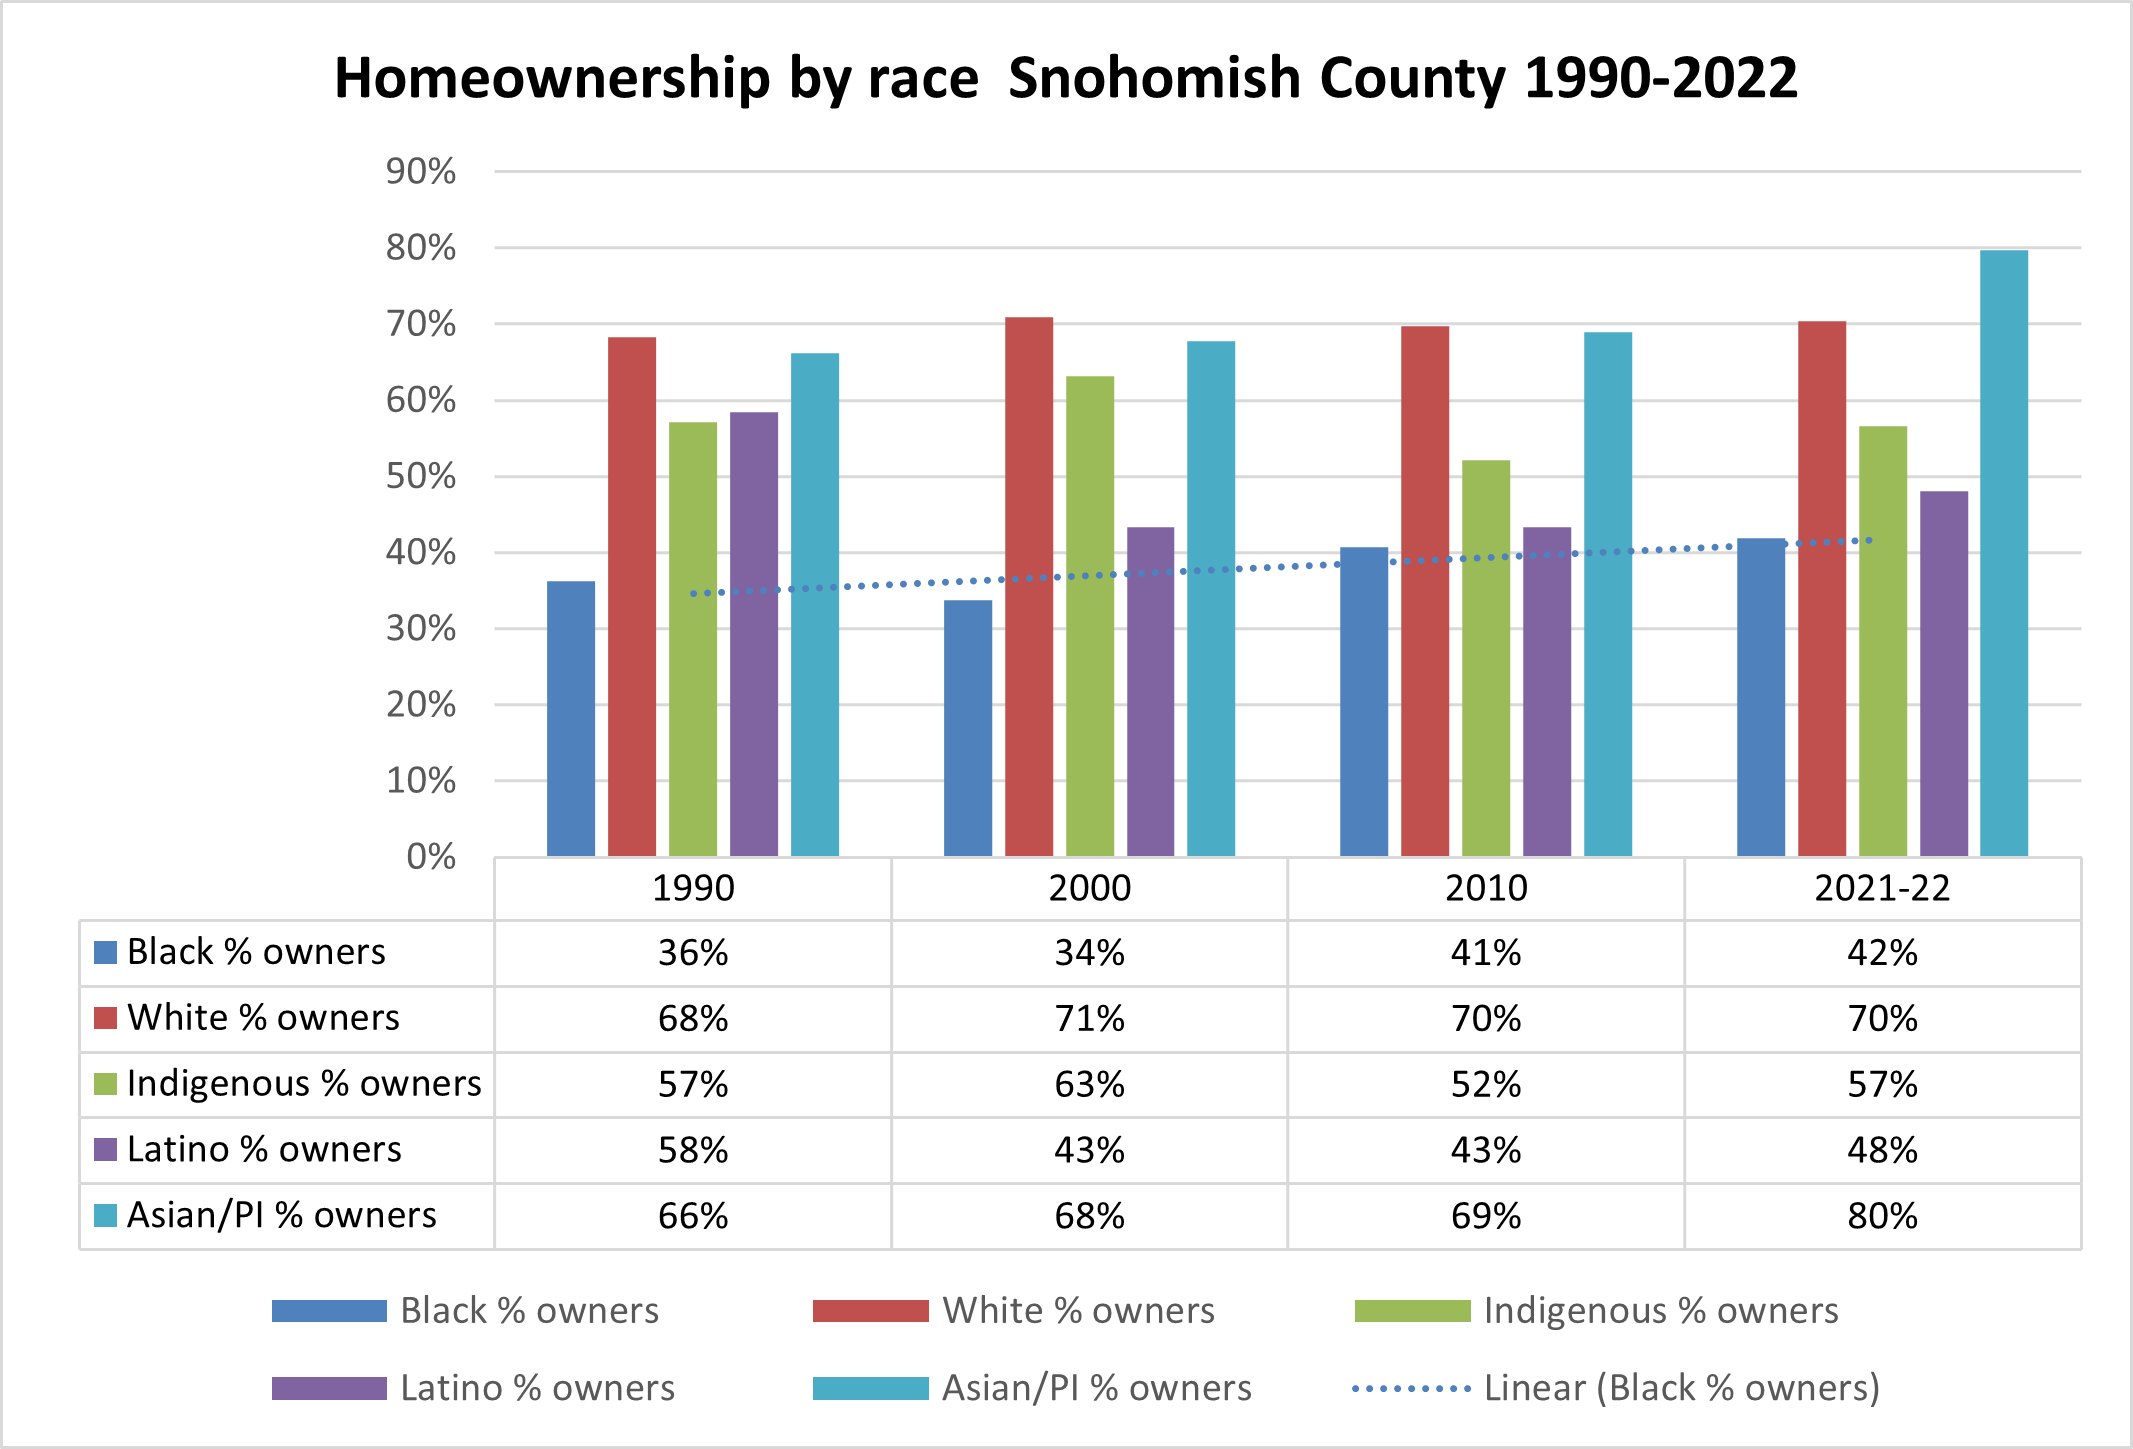
Home ownership in Snohomish County has followed a disturbing pattern in recent decades. While 70% of White families are able to own homes, most Black and Latino families do not.
As late as 1990, the county population was 93% White. The number of African Americans, Asian and Pacific Islanders, and especially Latinos have increased steadily over the last three decades accompanied by modest changes in homeownership rates. Black ownership rates ranged from 34% to 43% while White and Asian American rates hovered around 70%. Through 1990, the majority of Latinx households owned homes, but as that population has increased, the rate of homeowners has declined. Tulalip and other Indigenous Americans have been able to purchase homes at somewhat higher rates.
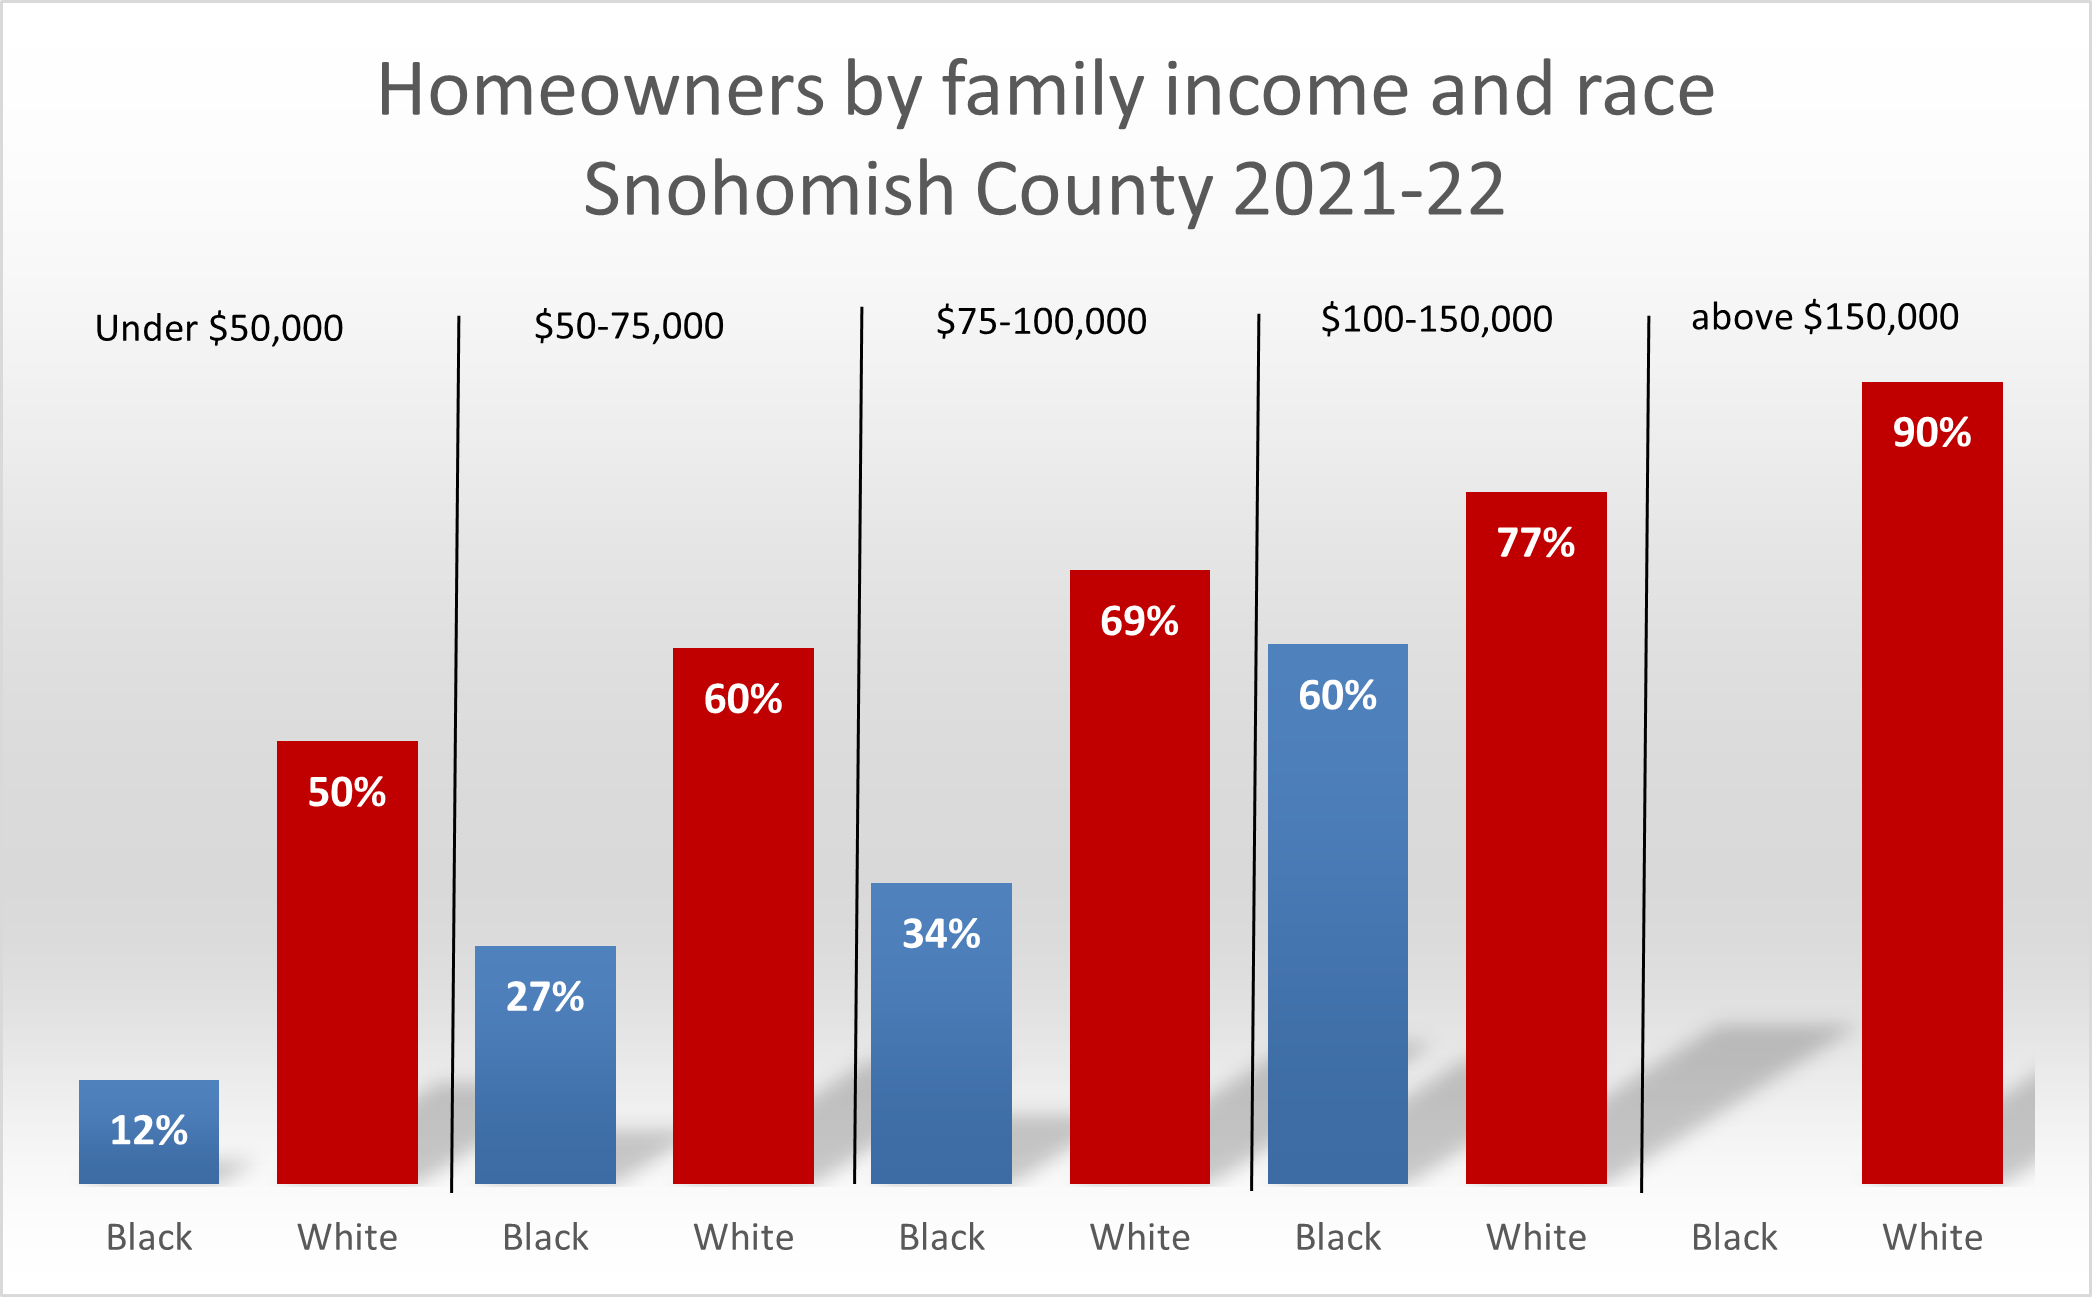
In the chart below we compare White and Black homeownership at different family income levels using the most recent census data. At every income level, White families are more likely to own homes than Black families. There were too few Black families in the top income sample to report, but for families earning $100,000-150,000 there is a 17% ownership gap which grows larger at more modest income levels. For those earning between $50,000 and $75,000, 60% of Whites were owners compared with only 27% of Blacks. And look at the difference among those earning less than $50,000. White families were four times as likely to be homeowners as Black families. Remarkably, 50% of White families at this modest income level were able to own homes. Here we see the effects of multigeneration wealth building. At current prices new buyers with modest incomes are shut out of homeownership unless they are converting homes long held in the family or other sources of wealth.
Notes:
The most recent years shown here is an average of 2021 and 2022 from annual American Community Surveys (ACS). The 2-year average improves the reliability of these calculations, all of which are based on samples of the full population (2% for 2021-22; 5% in other years). Because these are samples, it is unwise to report very small populations. For that reason the Black upper income category is left blank.
Homes in these calculations include condos as well as houses and ownership can mean buying with a mortgage or owning outright (which is most likely for White homeowners). Households as defined by the Census Bureau can include single individuals or a group of roommates as well as actual families. The race of the household follows the self-identified race of the person designated "head of household."
Race categories in these calculations treat Latino as an exclusive category. Thus the labels Black, White, Indigenous, and Asian do not include anyone who indicated Hispanic/Latino heritage. The category Asian, always complicated, includes Pacific Islanders, South Asians, and East Asians. These charts do not include persons who answered with two or more race categories. Only in recent census surveys was this an option.
Sources: These statistics are calculated from weighted samples of U.S. Census data produced by the Minnesota Population Center's IPUMS USA: Steven Ruggles, Sarah Flood, Ronald Goeken, Megan Schouweiler and Matthew Sobek. IPUMS USA: Version 12.0 [dataset]. Minneapolis, MN: IPUMS, 2022. https://doi.org/10.18128/D010.V12.0. The following samples: 1960 5%, 1970 1% Metro FM1 and F2, 1980 5% State, 1990 5% State, 2000 5%, 2010 10%, 2021-2022 ACS 2yr.