
by James Gregory
Arizona remains today a state where most residents came from somewhere else, either another state or another country. It is also a state where substantial tracts of land remain the property of Native nations--Navaho, Yuma, Pima, Apache, Pueblo, Papago, and Zuni. The United States seized the area in the war against Mexico in 1846, but few Americans found reason to settle there until silver and cooper deposits brought miners starting in the late 1870s. An 1870 population of less than 10,000 grew to 122,000 by 1900. Whites comprised less than half of the turn-of-the-century population. One third were ethnic Mexicans, born either in the Southwest or Mexico. Native peoples accounted for more than 20 percent of persons enumerated in the 1900 census.
The 20th century saw slow but steady migration into the lightly populated territory, which became a state in 1912. Until 1940, many of the newcomers came from Mexico, Texas, Oklahoma, and Arkansas for the cotton boom that followed the building of the Roosevelt dam on the Salt River and expansion of irrigated agriculture. World War II changed the state's economy as the federal government established military bases and defense installations, setting off the cycles of mass migration that have made Arizona ever since one of the nation's fastest growing states, its population regularly doubling every twenty years since 1940. The influx changed the state's ethno/racial mix. Until the 1980s, most of the newcomers were Whites, often coming from Midwestern states. Since then the largest contributors of new population have been California, Mexico, and Texas. As a result, Latinx Americans are once again about one third of the population.
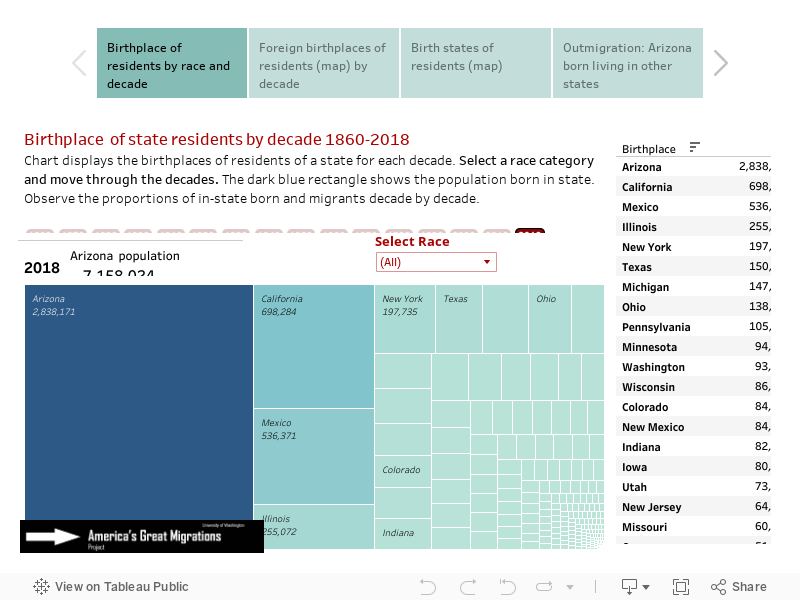
Notice in the visualization below that the dark blue rectangle representing population born in Arizona remains smaller than the out-of-state born throughout the 150 year period. This visualization tool is hosted by Tableau Public and may take a few seconds to respond. If slow, refresh the page. Click here for other state migration histories.
Move between four visualizations with tabs below
Note on data issues: Birth state information is missing for about 5% of US-born persons in 1970 and about 2% in 1960. These birthplaces are labeled "United States, ns" in the charts. Birthplaces were not recorded for enslaved persons in the 1850 and 1860 censuses, so it is not until 1870 that reliable data on African Americans became available. Native Americans were not routinely included in decennial censuses until 1900.
Source: U.S. Census data from the Minnesota Population Center's IPUMS USA: Steven Ruggles, Katie Genadek, Ronald Goeken, Josiah Grover, and Matthew Sobek. Integrated Public Use Microdata Series: Version 6.0 [Machine-readable database].
Maps, data development, calculations: James Gregory.