
by James Gregory
Utah is the great exception among western states. Brigham Young led members of the Church of Jesus Christ of Latter-Day Saints into the region in the 1840s when it was still part of Mexico. After the American conquest, the 1850 US census counted 11,380 residents -- most of whom had left New York. Illinois, and other states where the Mormon faith had its start. But in the next two decades, in contrast to the rest of the West, migration from eastern states slowed to a trickle and Utah began to display the high birth rates that have keyed population growth ever since. The other key for several generations involved Mormon converts from England, Scotland, Denmark, Sweden, and Germany. Utah gained statehood in 1896 and the census four years later recorded a population of 276,000, nearly two-thirds of them born in state. The minority born outside Utah included 46,000 migrants from northern Europe, close to the number claiming all other birthplaces.
European immigration slowed in the 20th century while the high birth rate continued to fuel a steady population increase. In 1960, the population reached 890,000 with 74% of residents born in state. Since the 1980s, Utah has been attracting newcomers with its booming economy and scenic mountains and recreational opportunities. Many newcomers have come from other western states, especially California. More than 260,000 Californians were counted in the 2022 ACS census. Still one of the whitest states, Utah has been attracting Latinx migrants and some Asian migrants in the last several decades. Latinx newcomers have arrived from Mexico, Central and South America, and also in significant numbers from California and Texas.
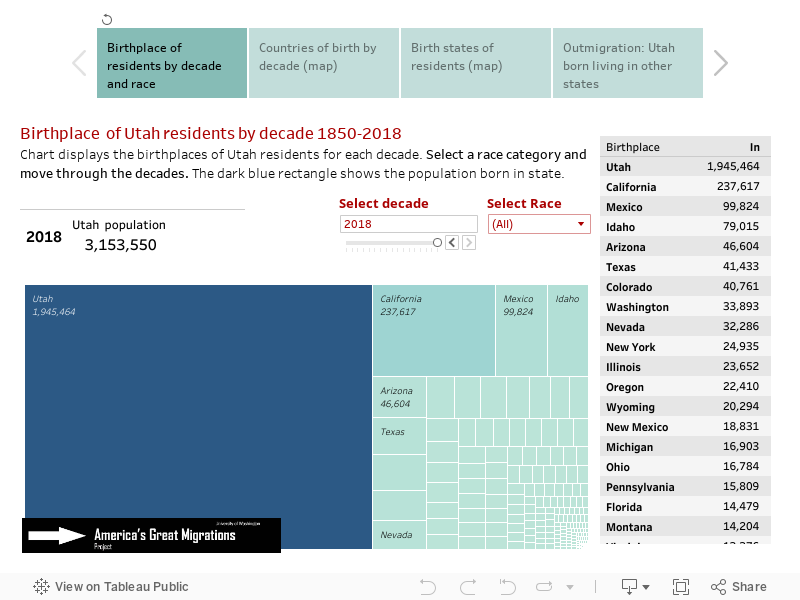
Notice in the visualization below that the dark blue rectangle representing population born in state remains smaller than the out-of-state born throughout the 170 year period. This visualization tool is hosted by Tableau Public and may take a few seconds to respond. If slow, refresh the page. Click here for other state migration histories.
Move between four visualizations with tabs below
Note on data issues: Birth state information is missing for about 5% of US-born persons in 1970 and about 2% in 1960. These birthplaces are labeled "United States, ns" in the charts. Birthplaces were not recorded for enslaved persons in the 1850 and 1860 censuses, so it is not until 1870 that reliable data on African Americans became available. Native Americans were not routinely included in decennial censuses until 1900.
Source: U.S. Census data from the Minnesota Population Center's IPUMS USA: Steven Ruggles, Katie Genadek, Ronald Goeken, Josiah Grover, and Matthew Sobek. Integrated Public Use Microdata Series: Version 6.0 [Machine-readable database]. Minneapolis: University of Minnesota, 2015, the following samples: 1850 1%, 1860 1%, 1870 1%, 1880 1% 1900 1%, 1910 1%, 1920 1%, 1930 1%, 1940 1%, 1950 1%, 1960 5%, 1970 1% State FM1, 1980 5% State, 1990 5% State, 2000 1%, 2010 ACS, 2022 ACS.
Maps, data development, calculations: James Gregory.