
by James Gregory
California's history is keyed to migration. The most populous state in the union became so because so many people from other states and other lands have moved there. It was not until 2010 that the number of native-born Californians surpassed the number who had migrated from somewhere else. And still today most adults are from another state or another country.
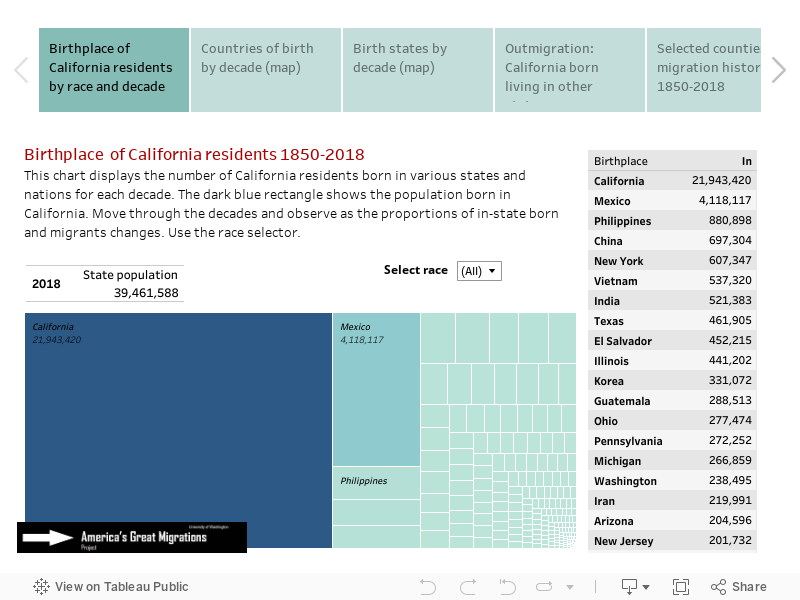
Migration predated the period of US control notably when Spain sent soldiers and missionaries into the area they named California. It accelerated after the United States seized the Mexican province and immediately profited from the 1848 discovery of gold in the Sierra foothills. The 1850 US census counted 92,597 residents and recorded birthplaces from around the world while neglecting to estimate the surviving populations of Indigenous Californians. In that census, New Yorkers led, followed by Mexicans, migrants from several northeastern states, then Ireland, and Germany. Twenty years later the population had passed 560,000 and Ireland, China, New York, Germany, and England led the list of contributors. In the first half of the twentieth century, immigration from abroad slowed while cross-country moves accelerated, especially from the Midwest and western South. In 1950, Texas, Illinois, Oklahoma, and Missouri were the top birthplaces for those born outside California, and those states had been sending both Black and White folk. Following passage of the 1965 Immigration Reform Act, migration from other lands resumed, particularly from Latin America and Asia, and California reflected the change more than almost any state. In 2022, nearly four million Californians claimed birthplaces in Mexico, followed by 856,000 from the Philippines, 693,000 from China, and more than one half million from Vietnam and India. For a more detailed overview see "The Shaping of California History."
Notice in the first visualization below that the dark blue rectangle representing population born in California grows and shrinks at various time periods, suggesting the changing importance of migration. In 1930 only about one third of residents were born in state. In 2010 and 2022, the proportion edged past fifty percent. Select Latinx and see a different sequence. This mapping tool is hosted by Tableau Public. If slow, refresh the page. Click here for other state migration histories.
Move between five maps and charts by selecting tabs below
Note on data issues: Birth state information is missing for about 5% of US-born persons in 1970 and about 2% in 1960. These birthplaces are labeled "United States, ns" in the charts. Birthplaces were not recorded for enslaved persons in the 1850 and 1860 censuses, so it is not until 1870 that reliable data on African Americans became available. Native Americans were not routinely included in decennial censuses until 1900.
Source: U.S. Census data from the Minnesota Population Center's IPUMS USA: Steven Ruggles, Katie Genadek, Ronald Goeken, Josiah Grover, and Matthew Sobek. Integrated Public Use Microdata Series: Version 6.0 [Machine-readable database]. Minneapolis: University of Minnesota, 2015, the following samples: 1850 1%, 1860 1%, 1870 1%, 1880 1% 1900 1%, 1910 1%, 1920 1%, 1930 1%, 1940 1%, 1950 1%, 1960 5%, 1970 1% State FM1, 1980 5% State, 1990 5% State, 2000 1%, 2010 ACS, 2022 ACS.
Maps, data development, calculations: James Gregory.