
by James Gregory
Colorado remains today a state where most residents came from somewhere else, either another state or another country. Cheyenne, Shoshone, Arapahoe, Ute, and other native nations commanded the area until 1848 when the United States seized it in its war against Mexico. The discovery of gold near Pike's Peak in 1857 set up the first significant influx of newcomers, mostly whites from Midwestern and Northeastern states. Subsequent discoveries of silver, lead, copper, and coal deposits brought more miners and earned Colorado statehood in 1876 with a population that reached 194,000 in 1880 and 539,000 by 1900. Migration continued at a steady pace in the 20th century, helping the population pass 1 million in 1930, 2 million by 1970. The newcomers came mostly from states in the Midwest and included few from outside the United States and even fewer migrants of color. That has changed since the 1970s. Migration helped push the population to 3 million in 1990, 4 million by 2000, and 5 million ten years later. California, Mexico, and Texas have been the leading contributors during these decades and Colorado has become more ethnically diverse, attracting Latinx migrants from other states as well as from Mexico and Central America, and attracting Asian immigrants from Vietnam, China, Korea, and the Philippines.
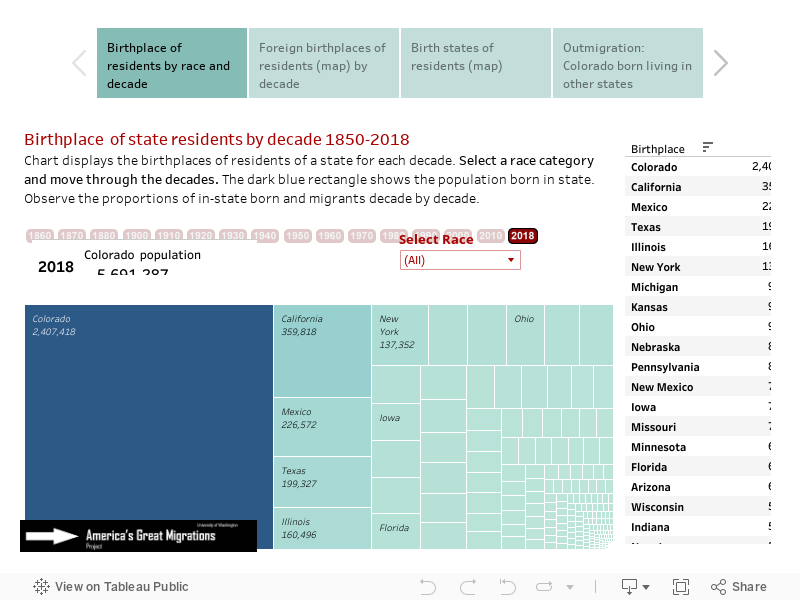
Notice in the visualization below that the dark blue rectangle representing population born in state remains smaller than the out-of-state born throughout the 160 year period. This visualization tool is hosted by Tableau Public and may take a few seconds to respond. If slow, refresh the page. Click here for other state migration histories.
Move between four visualizations with tabs below
Note on data issues: Birth state information is missing for about 5% of US-born persons in 1970 and about 2% in 1960. These birthplaces are labeled "United States, ns" in the charts. Birthplaces were not recorded for enslaved persons in the 1850 and 1860 censuses, so it is not until 1870 that reliable data on African Americans became available. Native Americans were not routinely included in decennial censuses until 1900.
Source: U.S. Census data from the Minnesota Population Center's IPUMS USA: Steven Ruggles, Katie Genadek, Ronald Goeken, Josiah Grover, and Matthew Sobek. Integrated Public Use Microdata Series: Version 6.0 [Machine-readable database]. Minneapolis: University of Minnesota, 2015, the following samples: 1850 1%, 1860 1%, 1870 1%, 1880 1% 1900 1%, 1910 1%, 1920 1%, 1930 1%, 1940 1%, 1950 1%, 1960 5%, 1970 1% State FM1, 1980 5% State, 1990 5% State, 2000 1%, 2010 ACS, 2022 ACS.
Maps, data development, calculations: James Gregory.