
by James Gregory
Until World War II, Virginia shared the demographic and migration patterns common to Southeastern states. The state attracted few newcomers aside from those moving short distances across the borders of continguous states. Natural increase among African American and white Virginians drove population gains while outmigration exceeded all avenues of inmigration.
World War II brought military installations and defense industries that began to reshape the economy, while the fast-growing federal bureaucracy across the river in Washington DC gave northern Virginia its first commuter suburbs. By 1950 the state's population had surged past three million and would grow faster and faster in the decades to come, passing five million in the mid 1970s, seven million by the year 2000, eight million a decade later. Much of this growth was from migration. And from new directions. Neighboring states remained big contributors but migrants from northeastern states became an important part of the population in the late decades of the 20th century. The 2000 census found that New York was second only to Virginia as a birthplace of residents. Pennsylvania, New Jersey, and Ohio were also high on the list.
Migration from abroad remained modest throughout the 20th century, but has become important since then. 2022 found more than 105,000 Salvadorans and 250,000 others from Latin American countries living in Virgina, along with nearly 400,000 migrants from Asian countries and 150,000 African immigrants.
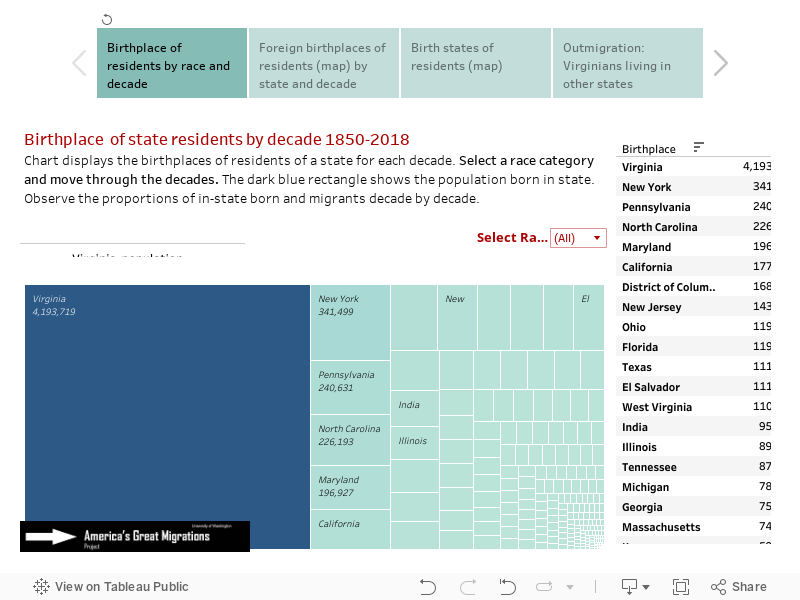
Notice in the visualization below that the dark blue rectangle representing population born in state fills most of the chart until 1940 and then shrinks over the last eighty years as the state has attracted millions of newcomers from other states and nations. Since 2000, migrants have outnumbered those Virginians born in the state. This visualization tool is hosted by Tableau Public and may take a few seconds to respond. If slow, refresh the page. Click here for other state migration histories.
Move between four visualizations with tabs below
Note on data issues: The 1850 and 1860 censuses counted only "free persons" so it was not until 1870 that reliable data on African Americans became available. Native Americans were not routinely included in decennial censuses until 1900. Birth state information is missing for about 5% of US-born persons in 1970 and about 2% in 1960. The missing are designated "United States,ns" in the charts.
Source: U.S. Census data from the Minnesota Population Center's IPUMS USA: Steven Ruggles, Katie Genadek, Ronald Goeken, Josiah Grover, and Matthew Sobek. Integrated Public Use Microdata Series: Version 6.0 [Machine-readable database]. Minneapolis: University of Minnesota, 2015, the following samples: 1850 1%, 1860 1%, 1870 1%, 1880 1% 1900 1%, 1910 1%, 1920 1%, 1930 1%, 1940 1%, 1950 1%, 1960 5%, 1970 1% State FM1, 1980 5% State, 1990 5% State, 2000 1%, 2010 ACS, 2022 ACS.
Maps, data development, calculations: James Gregory.