
by James Gregory
Unlike most southern states, Texas has been a migration magnet throughout its history, which helps explain the record of growth that now makes it the second most populous state following California. Migration, most of it illegal, from Tennessee, Alabama, and Mississippi fueled the rebellion that wrestled the province from Mexico in 1836. In the decades that followed, an enormous number of southerners, many enslaved, moved west to expand the cotton belt. The 1860 census counted 169,000 enslaved persons, roughly 30% of the state population. After the civil war, whites continued to arrive from nearby southern states, causing the population to double by 1880 and double again in the following twenty years. African Americans contributed little to this late 19th century migration. Migration continued from the same southern states in the 20th century albeit at a somewhat reduced rate. Black Louisianans crossing the border into southeast Texas added the only new dimension to the state's African American population.
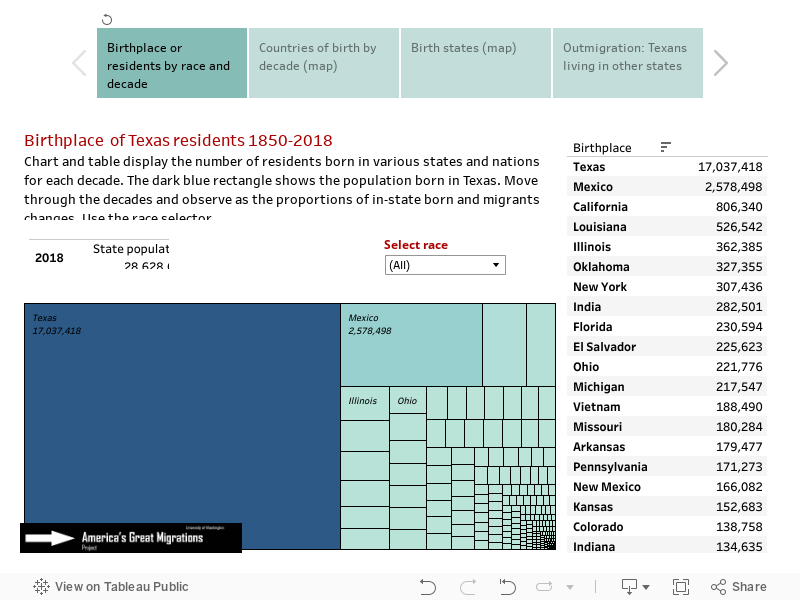
World War II brought military installations and defense industries that began to reshape the economy. Migration accelerated in the late 20th century, continuing to draw newcomers from across the South but also from Mexico, restarting the on-again off-again relationship so central to Texas history. Northerners and westerners also joined the flow. In the 2010 census, California followed Mexico as the most important out-of-state birthplace for persons residing in Texas. Indeed the recent census shows that apart from neighboring Oklahoma and Louisiana, southern state birthplaces have fallen behind Illinois, New York, India, Ohio, and Michigan.
Notice in the visualization below that the dark blue rectangle representing population born in state grows steadily until 1950 and then shrinks over the last sixty years as the state has attracted millions of newcomers from other states and nations. This visualization tool is hosted by Tableau Public and may take a few seconds to respond. If slow, refresh the page. Click here for other state migration histories.
Move between four visualizations with tabs below
Note on data issues: The 1850 and 1860 censuses counted only "free persons" so it was not until 1870 that reliable data on African Americans became available. Native Americans were not routinely included in decennial censuses until 1900. Birth state information is missing for about 5% of US-born persons in 1970 and about 2% in 1960. The missing are designated "United States,ns" in the charts.
Source: U.S. Census data from the Minnesota Population Center's IPUMS USA: Steven Ruggles, Katie Genadek, Ronald Goeken, Josiah Grover, and Matthew Sobek. Integrated Public Use Microdata Series: Version 6.0 [Machine-readable database]. Minneapolis: University of Minnesota, 2015, the following samples: 1850 1%, 1860 1%, 1870 1%, 1880 1% 1900 1%, 1910 1%, 1920 1%, 1930 1%, 1940 1%, 1950 1%, 1960 5%, 1970 1% State FM1, 1980 5% State, 1990 5% State, 2000 1%, 2010 ACS, 2022 ACS.
Maps, data development, calculations: James Gregory.