
by James Gregory
Alabama was a population replacement zone in the early 1800s as Choctaw, Creek, Chickisaw, and Cherokee people were driven west and their lands were sold off to White planters determined to profit from the expanding the cotton kingdom. Most of the newcomers replacing them were enslaved persons driven overland or by sea from Virginia, Maryland, and the Carolinas. Accurate numbers are not available until 1870 because earlier censuses counted only "free persons." In 1870, Black Alabamians comprised 45 percent of state's population. After the Civil War, Alabama demography turned inward. For the next century, until 1960s, few people moved into the state and population grew slowly, largely dependent upon "natural increase," an odd euphemism for the work of mothers.
Beginning with World War I, outmigration took a toll. Whites moved to Texas, Florida, Georgia and many other states; Blacks headed north. Alabama contributed massively to the "Great Migration" of African Americans. By 1980, more than one third of all Black folks born in Alabama resided in a northern or western state, notably Michigan, Ohio, Illinois, New York, and California. Cleveland's Black community carried the nickname "Alabama North."
Since the 1970s, the sunbelt shift of manufacturing and other jobs has helped Alabama attract newcomers. Most have come from neighboring southern states: Georgia, Florida, Mississippi, Tennessee, and Texas. And largely they have been Whites. The "reverse Great Migration" that saw northern-born African Americans move to Georgia, Florida, and other southern states in recent decades by-passed Alabama. On the other hand, a state that had never before attracted immigrants from abroad began to do so in the last 20 years. The numbers are still modest but Mexicans, Central Americans, Germans, Koreans, and Vietnamese have recently become part of Alabama's population.
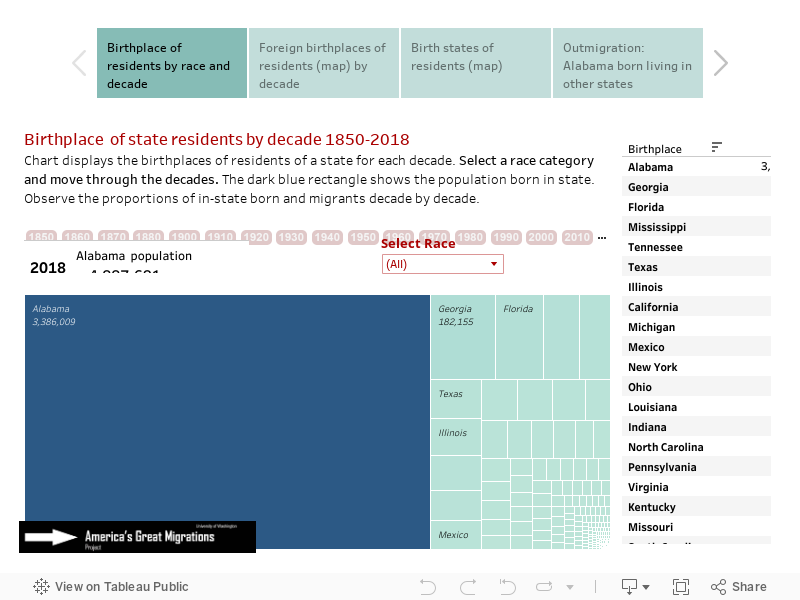
Notice in the visualization below that the dark blue rectangle representing population born in state grows steadily until 1960 and then begins to shrink as the state began to attract newcomers. This visualization tool is hosted by Tableau Public and may take a few seconds to respond. If slow, refresh the page. Click here for other state migration histories.
Move between four visualizations with tabs below
Note on data issues: The 1850 and 1860 censuses counted only "free persons" so it was not until 1870 that reliable data on African Americans became available. Native Americans were not routinely included in decennial censuses until 1900. Birth state information is missing for about 5% of US-born persons in 1970 and about 2% in 1960. The missing are designated "United States,ns" in the charts.
Source: U.S. Census data from the Minnesota Population Center's IPUMS USA: Steven Ruggles, Katie Genadek, Ronald Goeken, Josiah Grover, and Matthew Sobek. Integrated Public Use Microdata Series: Version 6.0 [Machine-readable database]. Minneapolis: University of Minnesota, 2015, the following samples: 1850 1%, 1860 1%, 1870 1%, 1880 1% 1900 1%, 1910 1%, 1920 1%, 1930 1%, 1940 1%, 1950 1%, 1960 5%, 1970 1% State FM1, 1980 5% State, 1990 5% State, 2000 1%, 2010 ACS, 2022 ACS.
Maps, data development, calculations: James Gregory.