
by James Gregory
New York has always been the gateway state, the state that absorbs the greatest diversity of newcomers from abroad. In 1850, when for the first time the US census recorded birthplaces, the leading birthplaces for residents not born in New York were in order: Ireland, Germany, England, Connecticut, Massachusetts, Vermont, New Jersey, and Canada, with a dozen other countries further down the list. In 2022, the leading out-of-state birthplaces were: Dominican Republic, China, India, New Jersey, Pennsylvania, Puerto Rico, Jamaica, Mexico.
The most populous state in the union in 1850 with more than 3 million people, New York continued to grow rapidly in part through migration, passing 7 million by 1900, 9 million by 1910, 12 million by 1930. Then growth slowed, reflecting the restrictive immigration law passed in 1924 and the lure of newer regions in the West. But the 20th century witnessed an important new inflow: the Great Migration of African Americans from the South. New York received more African American newcomers than any other state in the decades from 1910 to mid 1970s, with Virginia, the Carolinas, and Georgia the leading contributors. A second Black migration from Jamaica and the West Indies began at the same time, and then in the 1950s Puerto Ricans began to arrive in large numbers. Since the 1980s, the effects of immigration law changes have become evident as New York resumed its world gateway function. The 2022 census (ACS) recorded birthplaces from more than 100 different nations and all 50 states.
New York attracts newcomers while sending many of its sons and daughters to live elsewhere. Since the early 1800s, New Yorkers have contributed heavily to the population growth of other states. In the mid and late 19th century, the upper Midwest states were favorite targets of New Yorkers on the move. In the 20th century, California and Florida received hundreds of thousands of new residents from the Empire state. And in the last thirty years, New Yorkers have been settling in states up and down the eastern seaboard from Massacusetts to Florida.
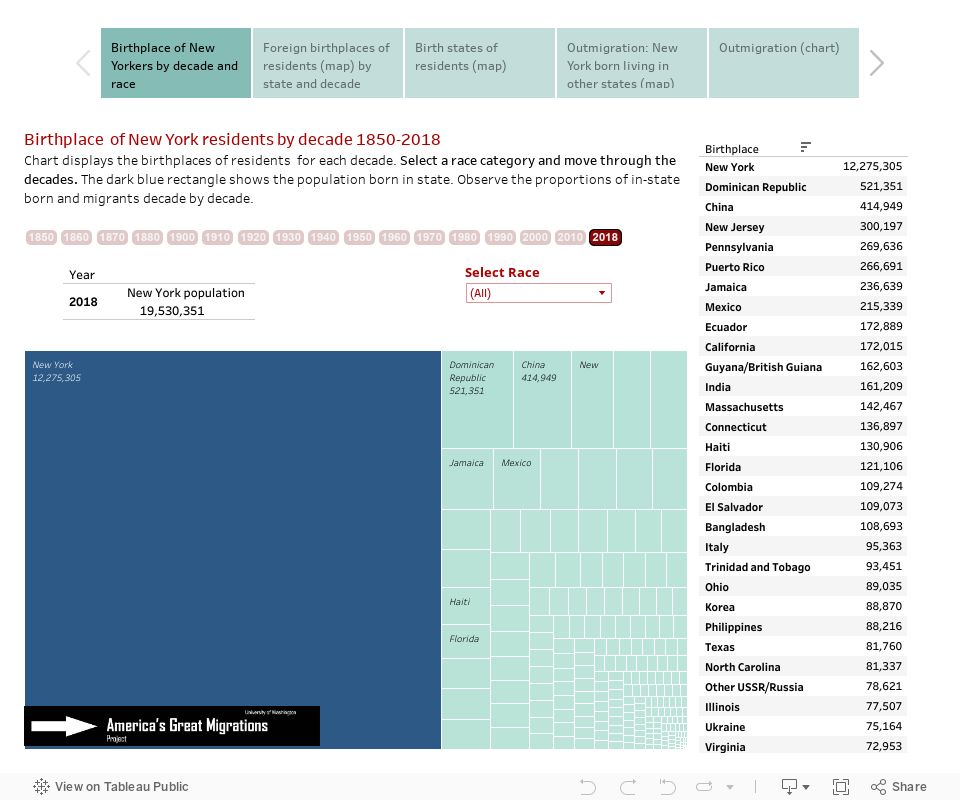
Notice in the visualization below that the dark blue rectangle representing population born in state grows and shrinks at various time periods, suggesting the changing importance of migration. These visualizations are hosted by Tableau Public and may take a few seconds to respond. If slow, refresh the page. Click here for other state migration histories.
Move between four visualizations with tabs below
Note on data issues: Birth state information is missing for about 5% of US-born persons in 1970 and about 2% in 1960. These birthplaces are labeled "United States, ns" in the charts. Birthplaces were not recorded for enslaved persons in the 1850 and 1860 censuses, so it is not until 1870 that reliable data on African Americans became available. Native Americans were not routinely included in decennial censuses until 1900.
Source: U.S. Census data from the Minnesota Population Center's IPUMS USA: Steven Ruggles, Katie Genadek, Ronald Goeken, Josiah Grover, and Matthew Sobek. Integrated Public Use Microdata Series: Version 6.0 [Machine-readable database]. Minneapolis: University of Minnesota, 2015, the following samples: 1850 1%, 1860 1%, 1870 1%, 1880 1% 1900 1%, 1910 1%, 1920 1%, 1930 1%, 1940 1%, 1950 1%, 1960 5%, 1970 1% State FM1, 1980 5% State, 1990 5% State, 2000 1%, 2010 ACS 1%, 2022 ACS 1%.
Maps, data development, calculations: James Gregory.